Last Wednesday’s CPI data was much anticipated by crypto traders as it had a direct impact on what the Fed would do at its next interest rate meeting scheduled for 14 June 2023. The data did not disappoint, as the inflation rate eased to 4.9% against expectations that it would be around 5%. The crypto markets cheered the falling inflation rate with an initial rally, only for it to be foiled by a fresh rumour that the US Department of Justice was selling its stash of BTC confiscated from the Silk Road platform.
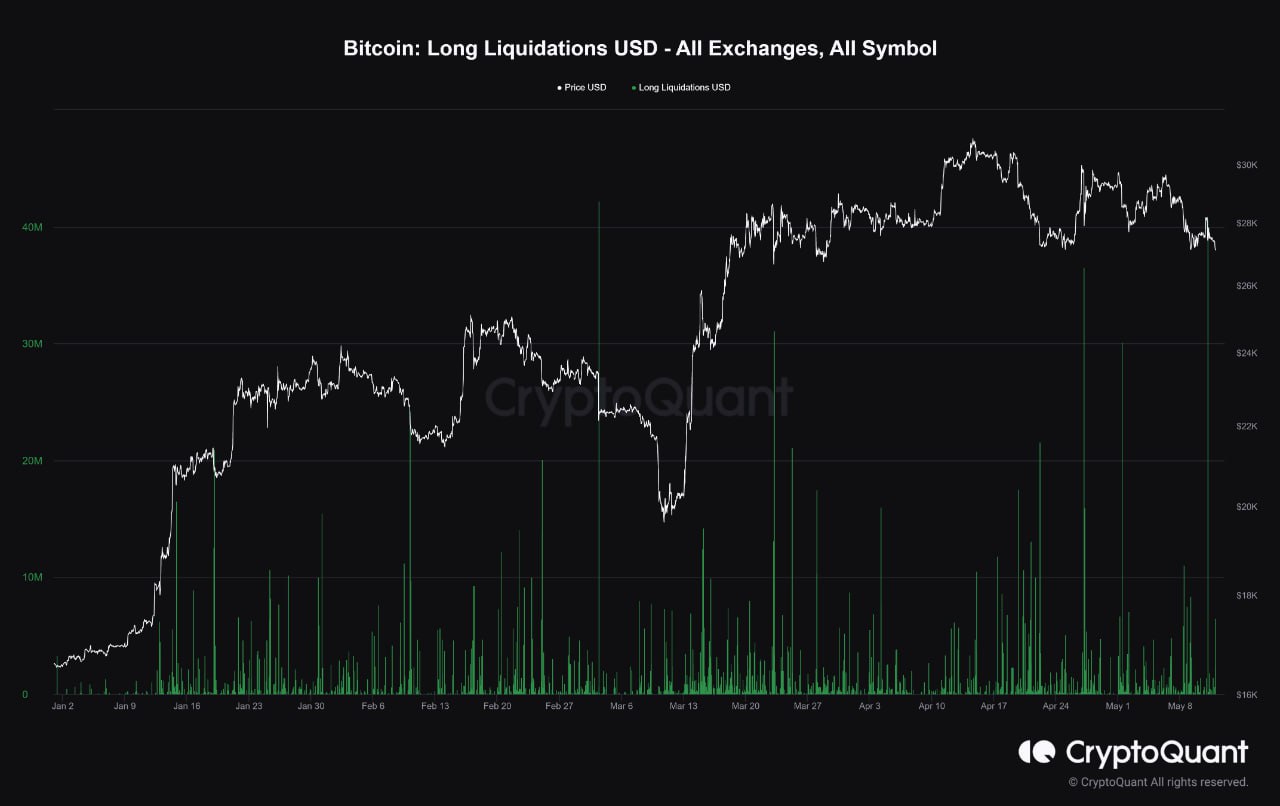
The price of BTC tanked around 8% within an hour of the rumour, falling from $28,300 to almost $26,800, liquidating around $36 million of long positions before the rumour turned out to be false again, in a repeat of the same pattern that happened two weeks ago.
Even though the rumor turned out to be false, the price of BTC and the broad crypto market did not manage to recover, especially when the craze in Bitcoin NFTs and BRC-20 tokens started to cool after being heated for a month. With the rapid price fall of the PEPE token last week, interest in BRC-20 tokens have fallen and even Bitcoin NFTs have also seen a markedly strong drop in interest since hitting an all-time-high early last week. The number of BTC Ordinal transactions fell from an all-time-high of 17,000 on 08 May to only 6,000 on 11 May, with trading volume falling from $18.13 million on 08 May to $4.86 million by 11 May. With a deflation in the BTC Ordinals and meme coin market, coupled with a lack of fresh catalyst, the entire crypto market dipped lower, with the price of BTC and ETH declining 10%.
Furthermore, the surge in gas fees and congestion in both the BTC and ETH blockchains during the transaction spikes early on in the week exposed the unsustainability of using BTC and ETH for massive scale purposes, which ultimately forced users to seek alternative blockchains. Litecoin (LTC), in this case, which has been ramping up its Ordinals capability, turned out to be the main beneficiary from the move.
LTC Transactions and Buyers Increase With LTC-20
The recent network congestion in BTC and gas fee surge in ETH has prompted users to use cheaper alternatives like LTC to transfer value over the blockchain. Furthermore, the Litecoin community’s proposal and subsequent launch of the LTC-20 token standard on 01 May, a similar fungible token creation module similar to the BRC-20 of Bitcoin, has propelled the number of LTC transactions to a huge spike last week, from under 100,000 transactions per day to an all-time-high of 585,000 on 10 May.

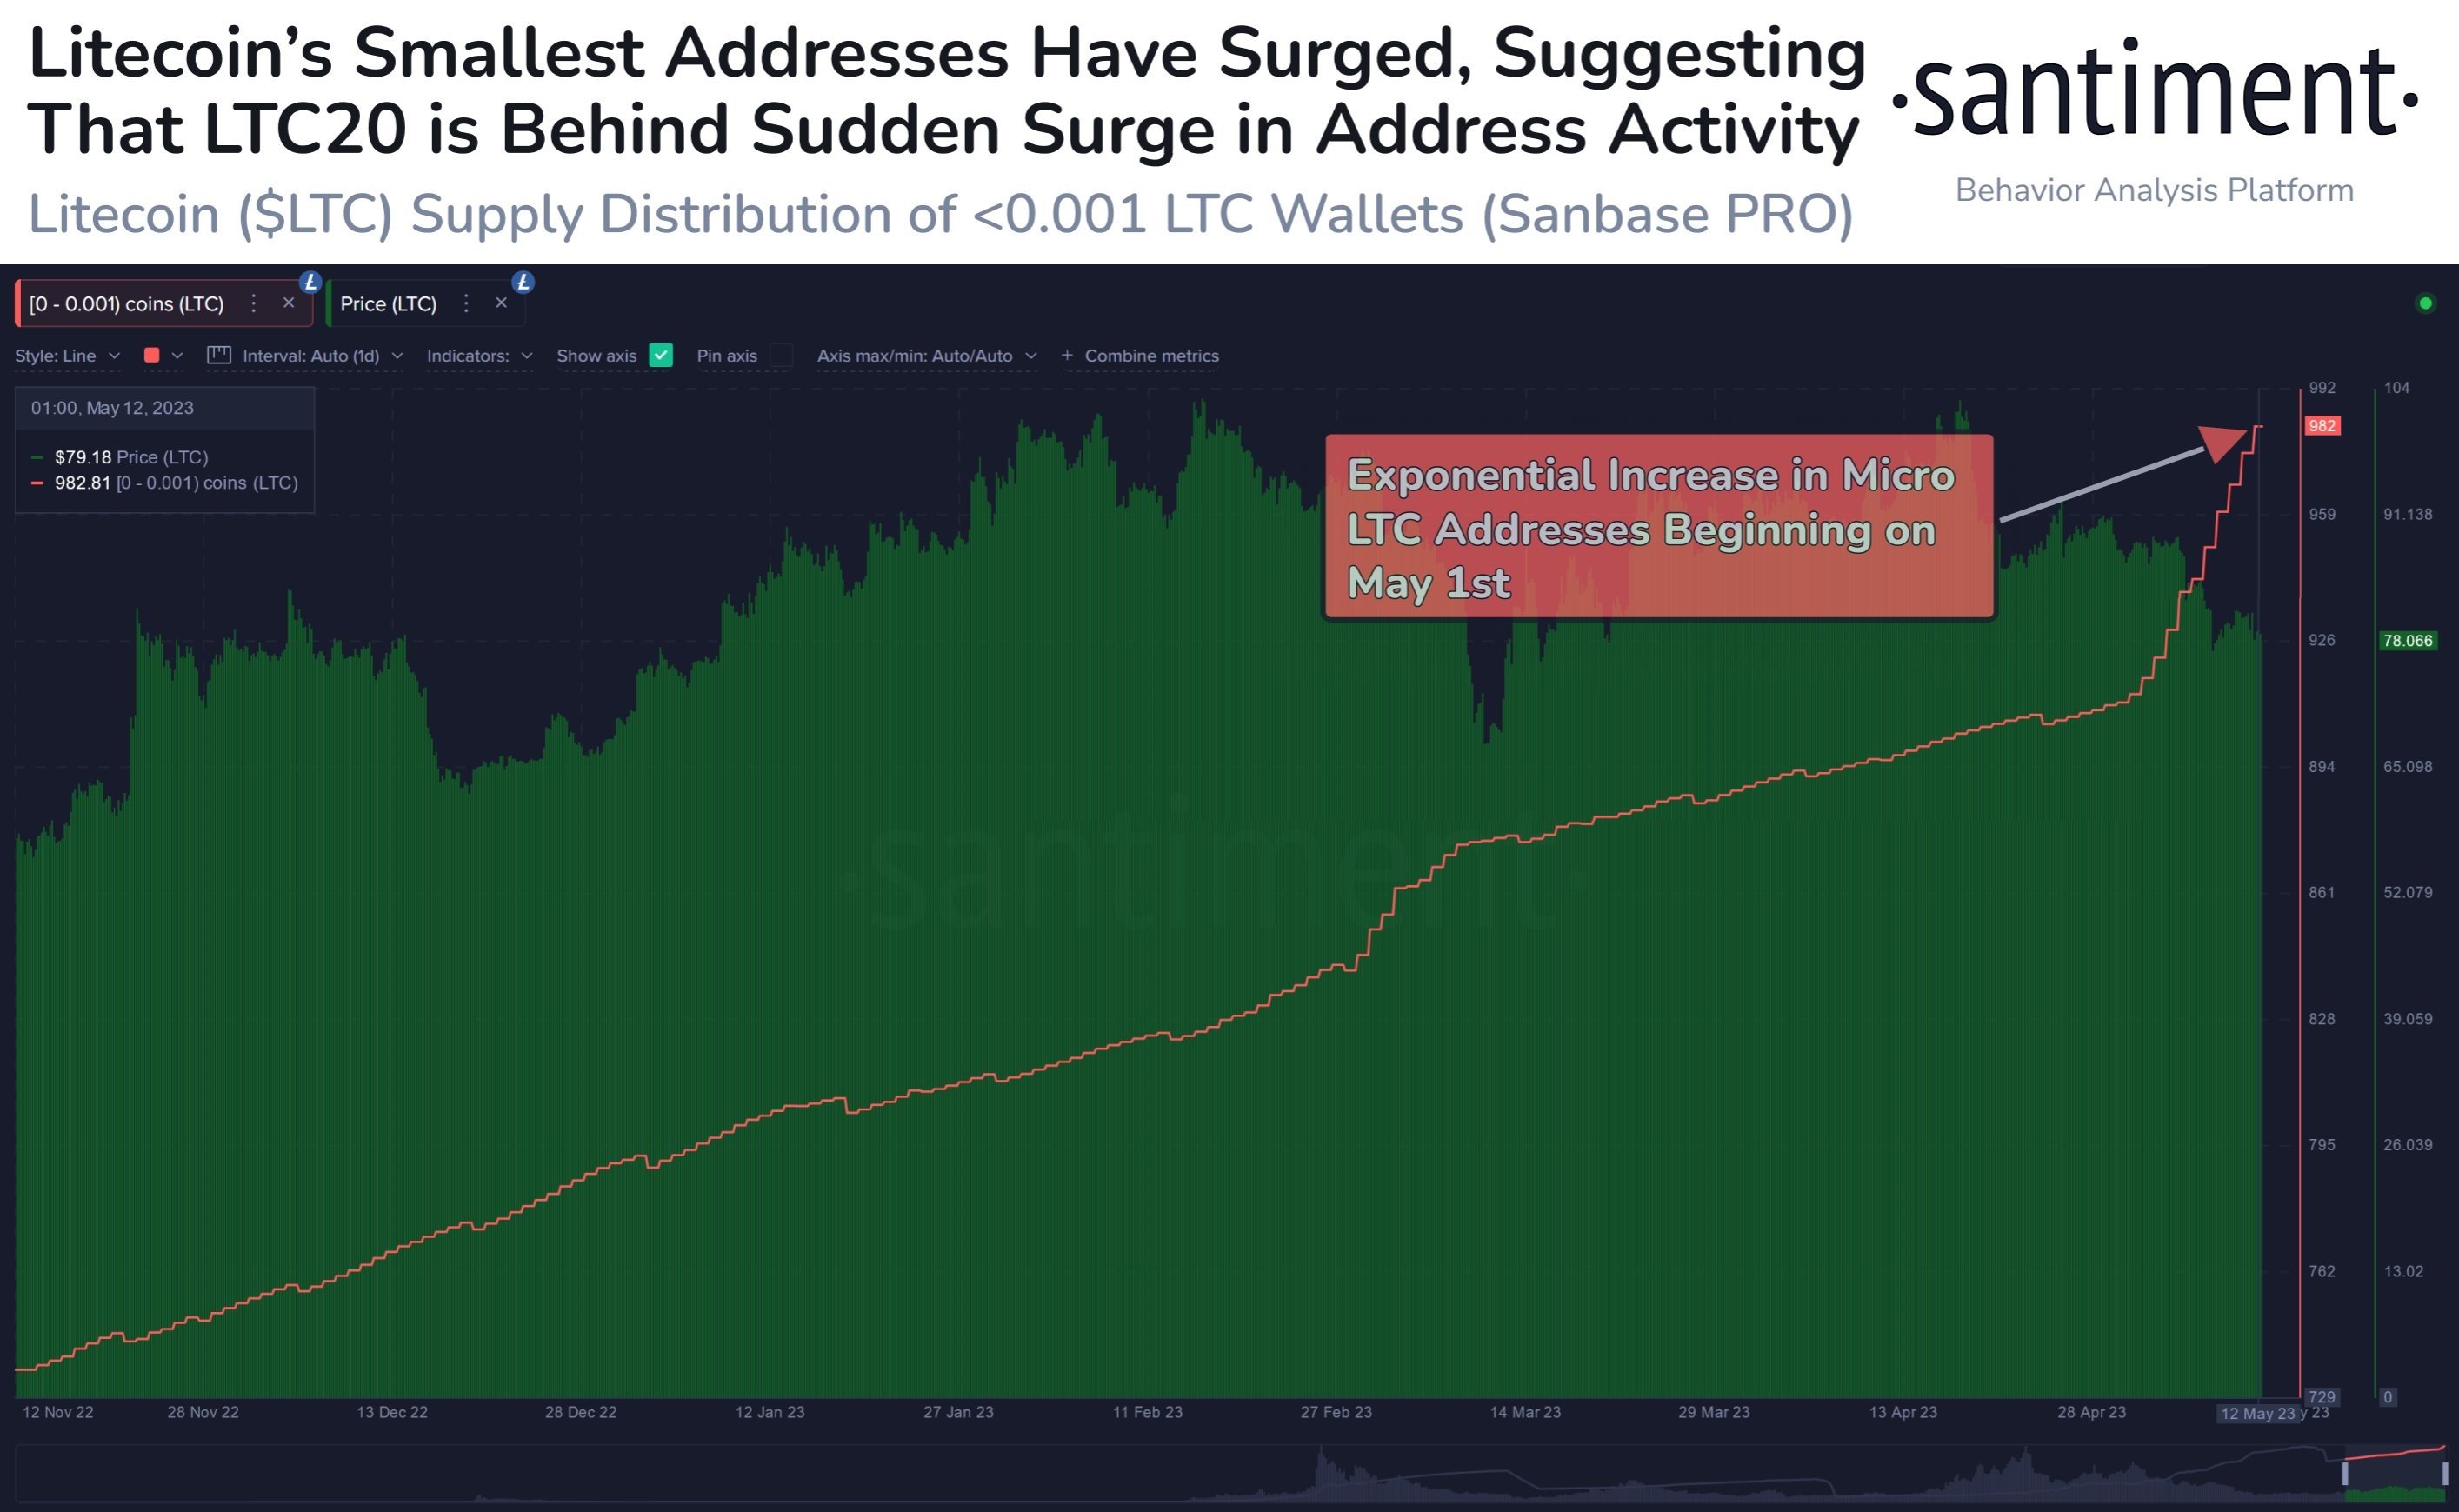
The number of LTC addresses have been on an increase since mid-April this year, perhaps as investors buy ahead of the upcoming halving which is anticipated to take place in August this year. However, a more interesting phenomenon where micro buyers of LTC who purchase less than 0.001 LTC have started picking up steam since 01 May.
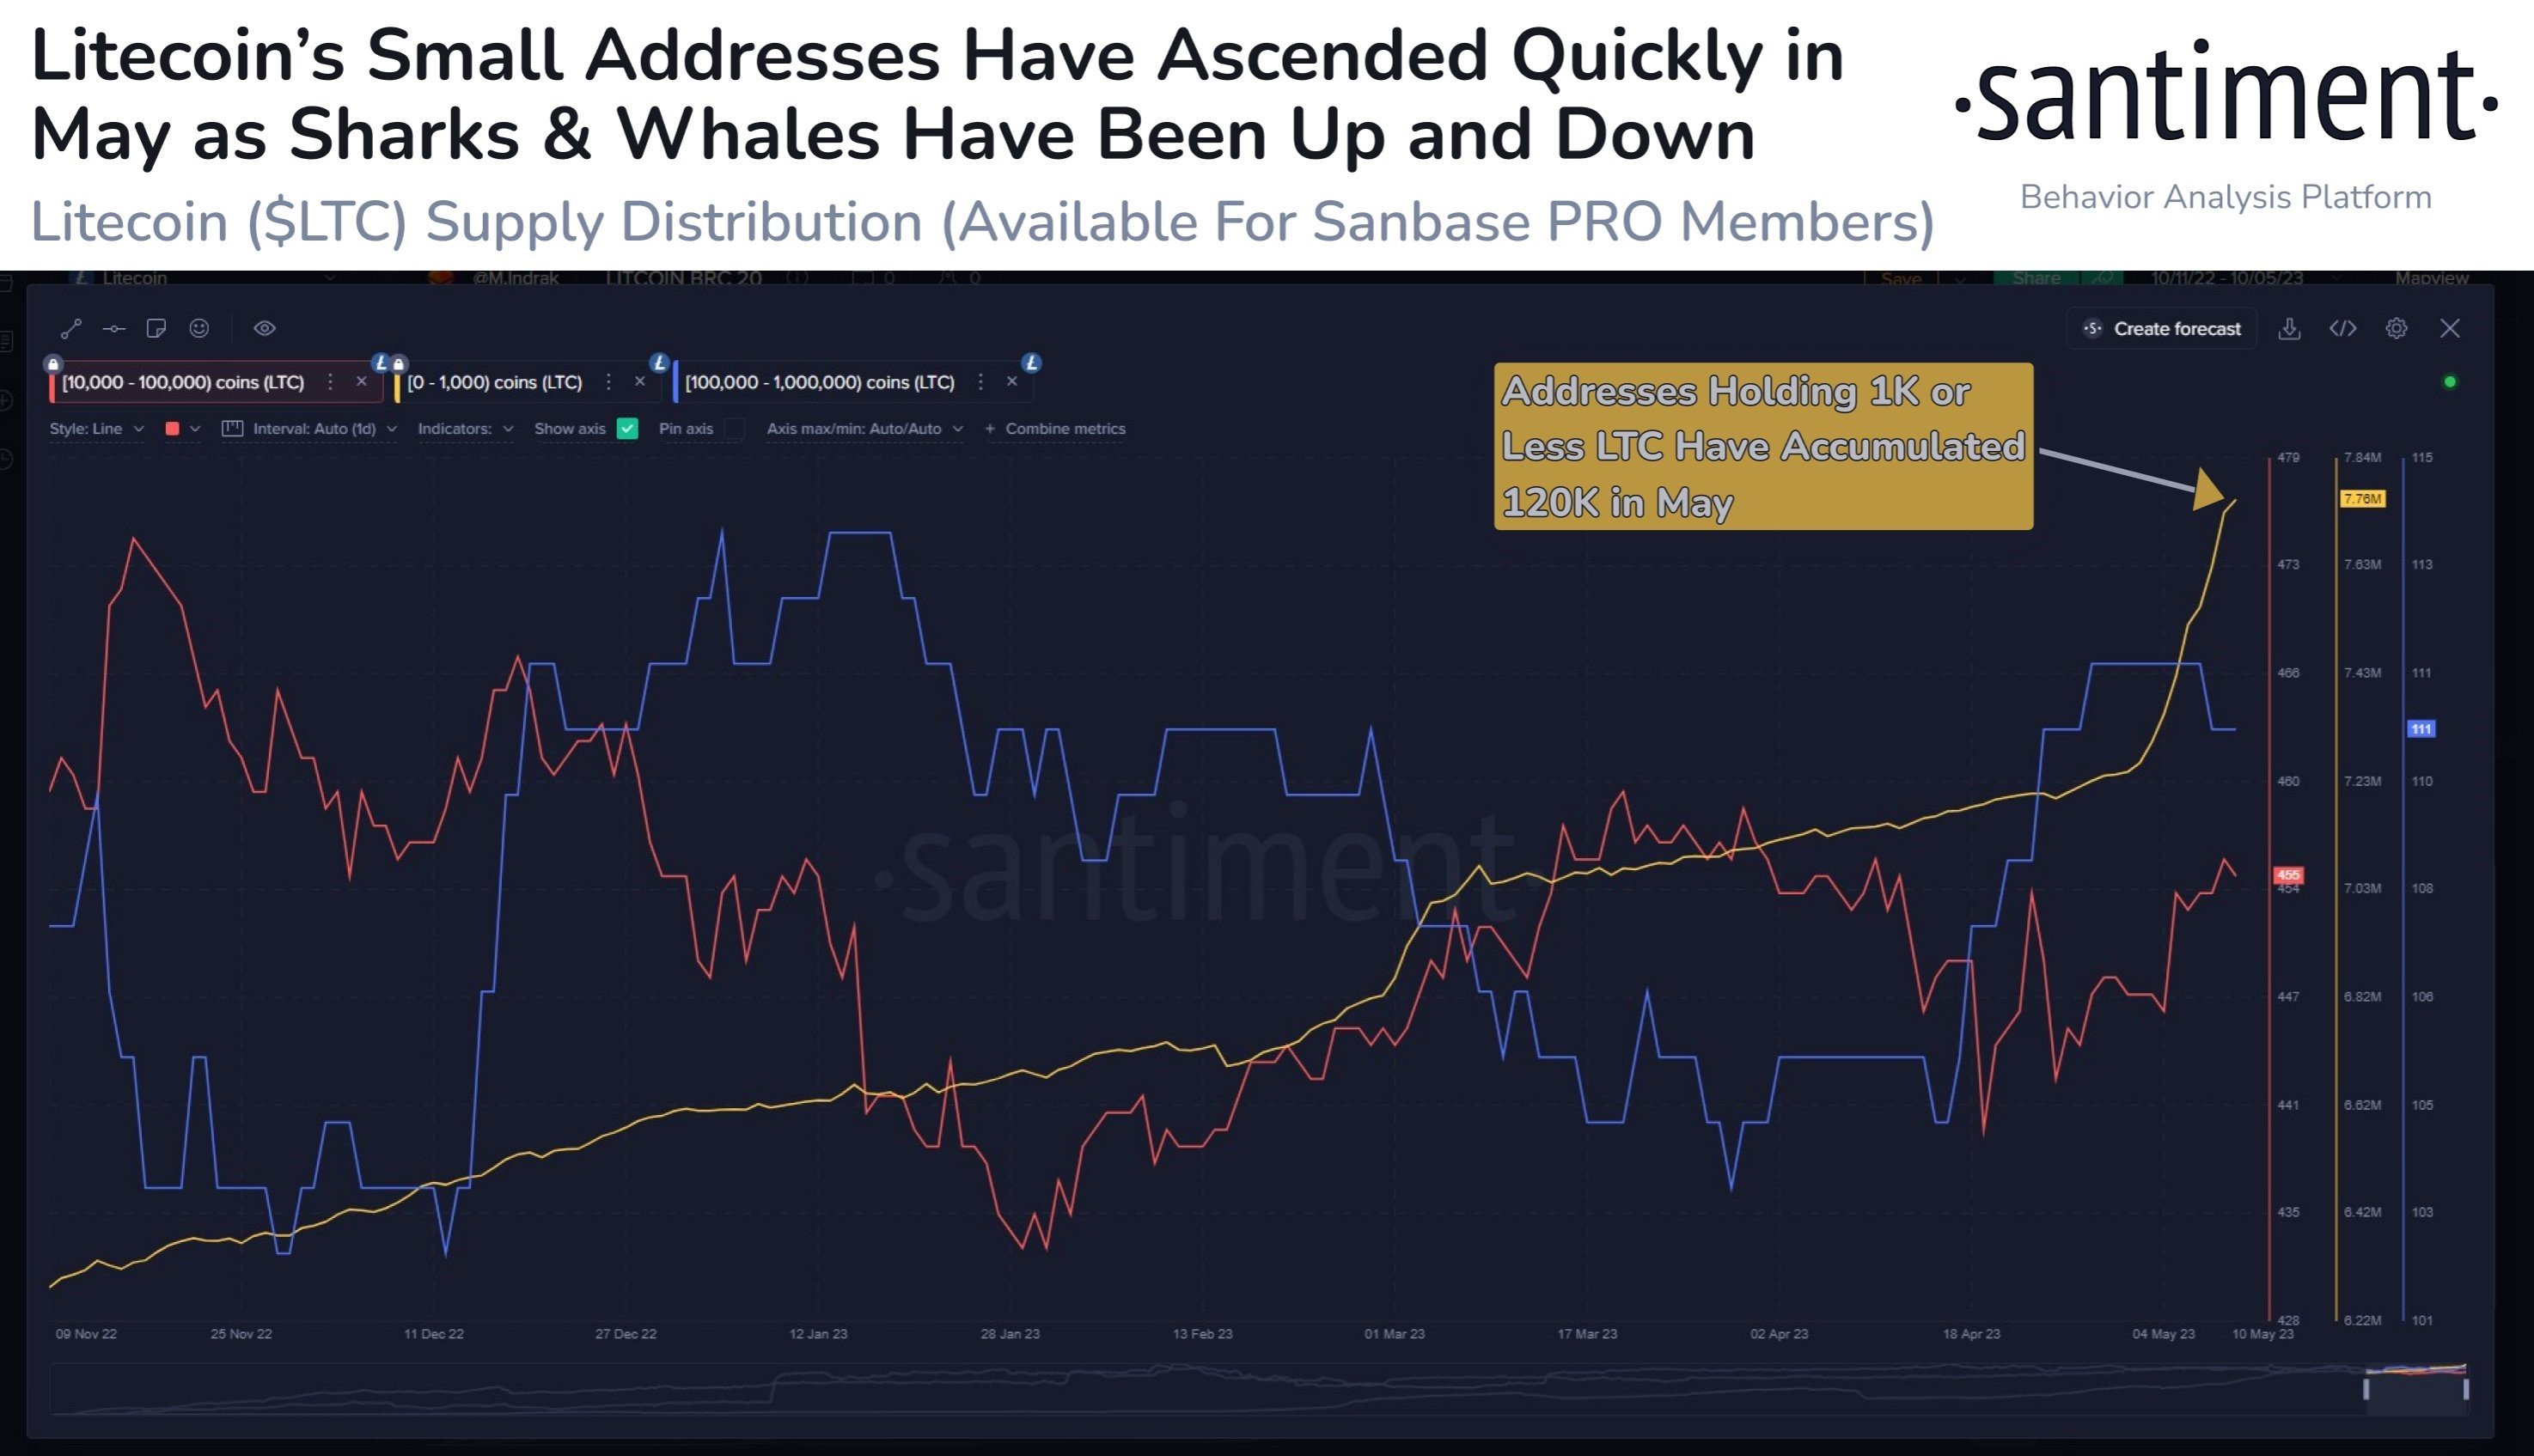
The timing of the huge surge in LTC micro transactions coincides with the launch of the LTC-20 token standard on 01 May. This may suggest that many retail users have been experimenting with using LTC-20 and should the trend continue, could bode well for the adoption of LTC by the mass market.
With less than 100 days to LTC’s halving in August, the network activities and price action of LTC could pick up in the coming days as its scarcity play gets intensified due to its newfound usage and upcoming block reward reduction from the halving. Hence, investors looking to pick up some attractive buys in the midst of the current market lull could consider accumulating some LTC on top of the more conventional buys like BTC and ETH.
BTC STH-MVRV Dropping Near to 1 Again
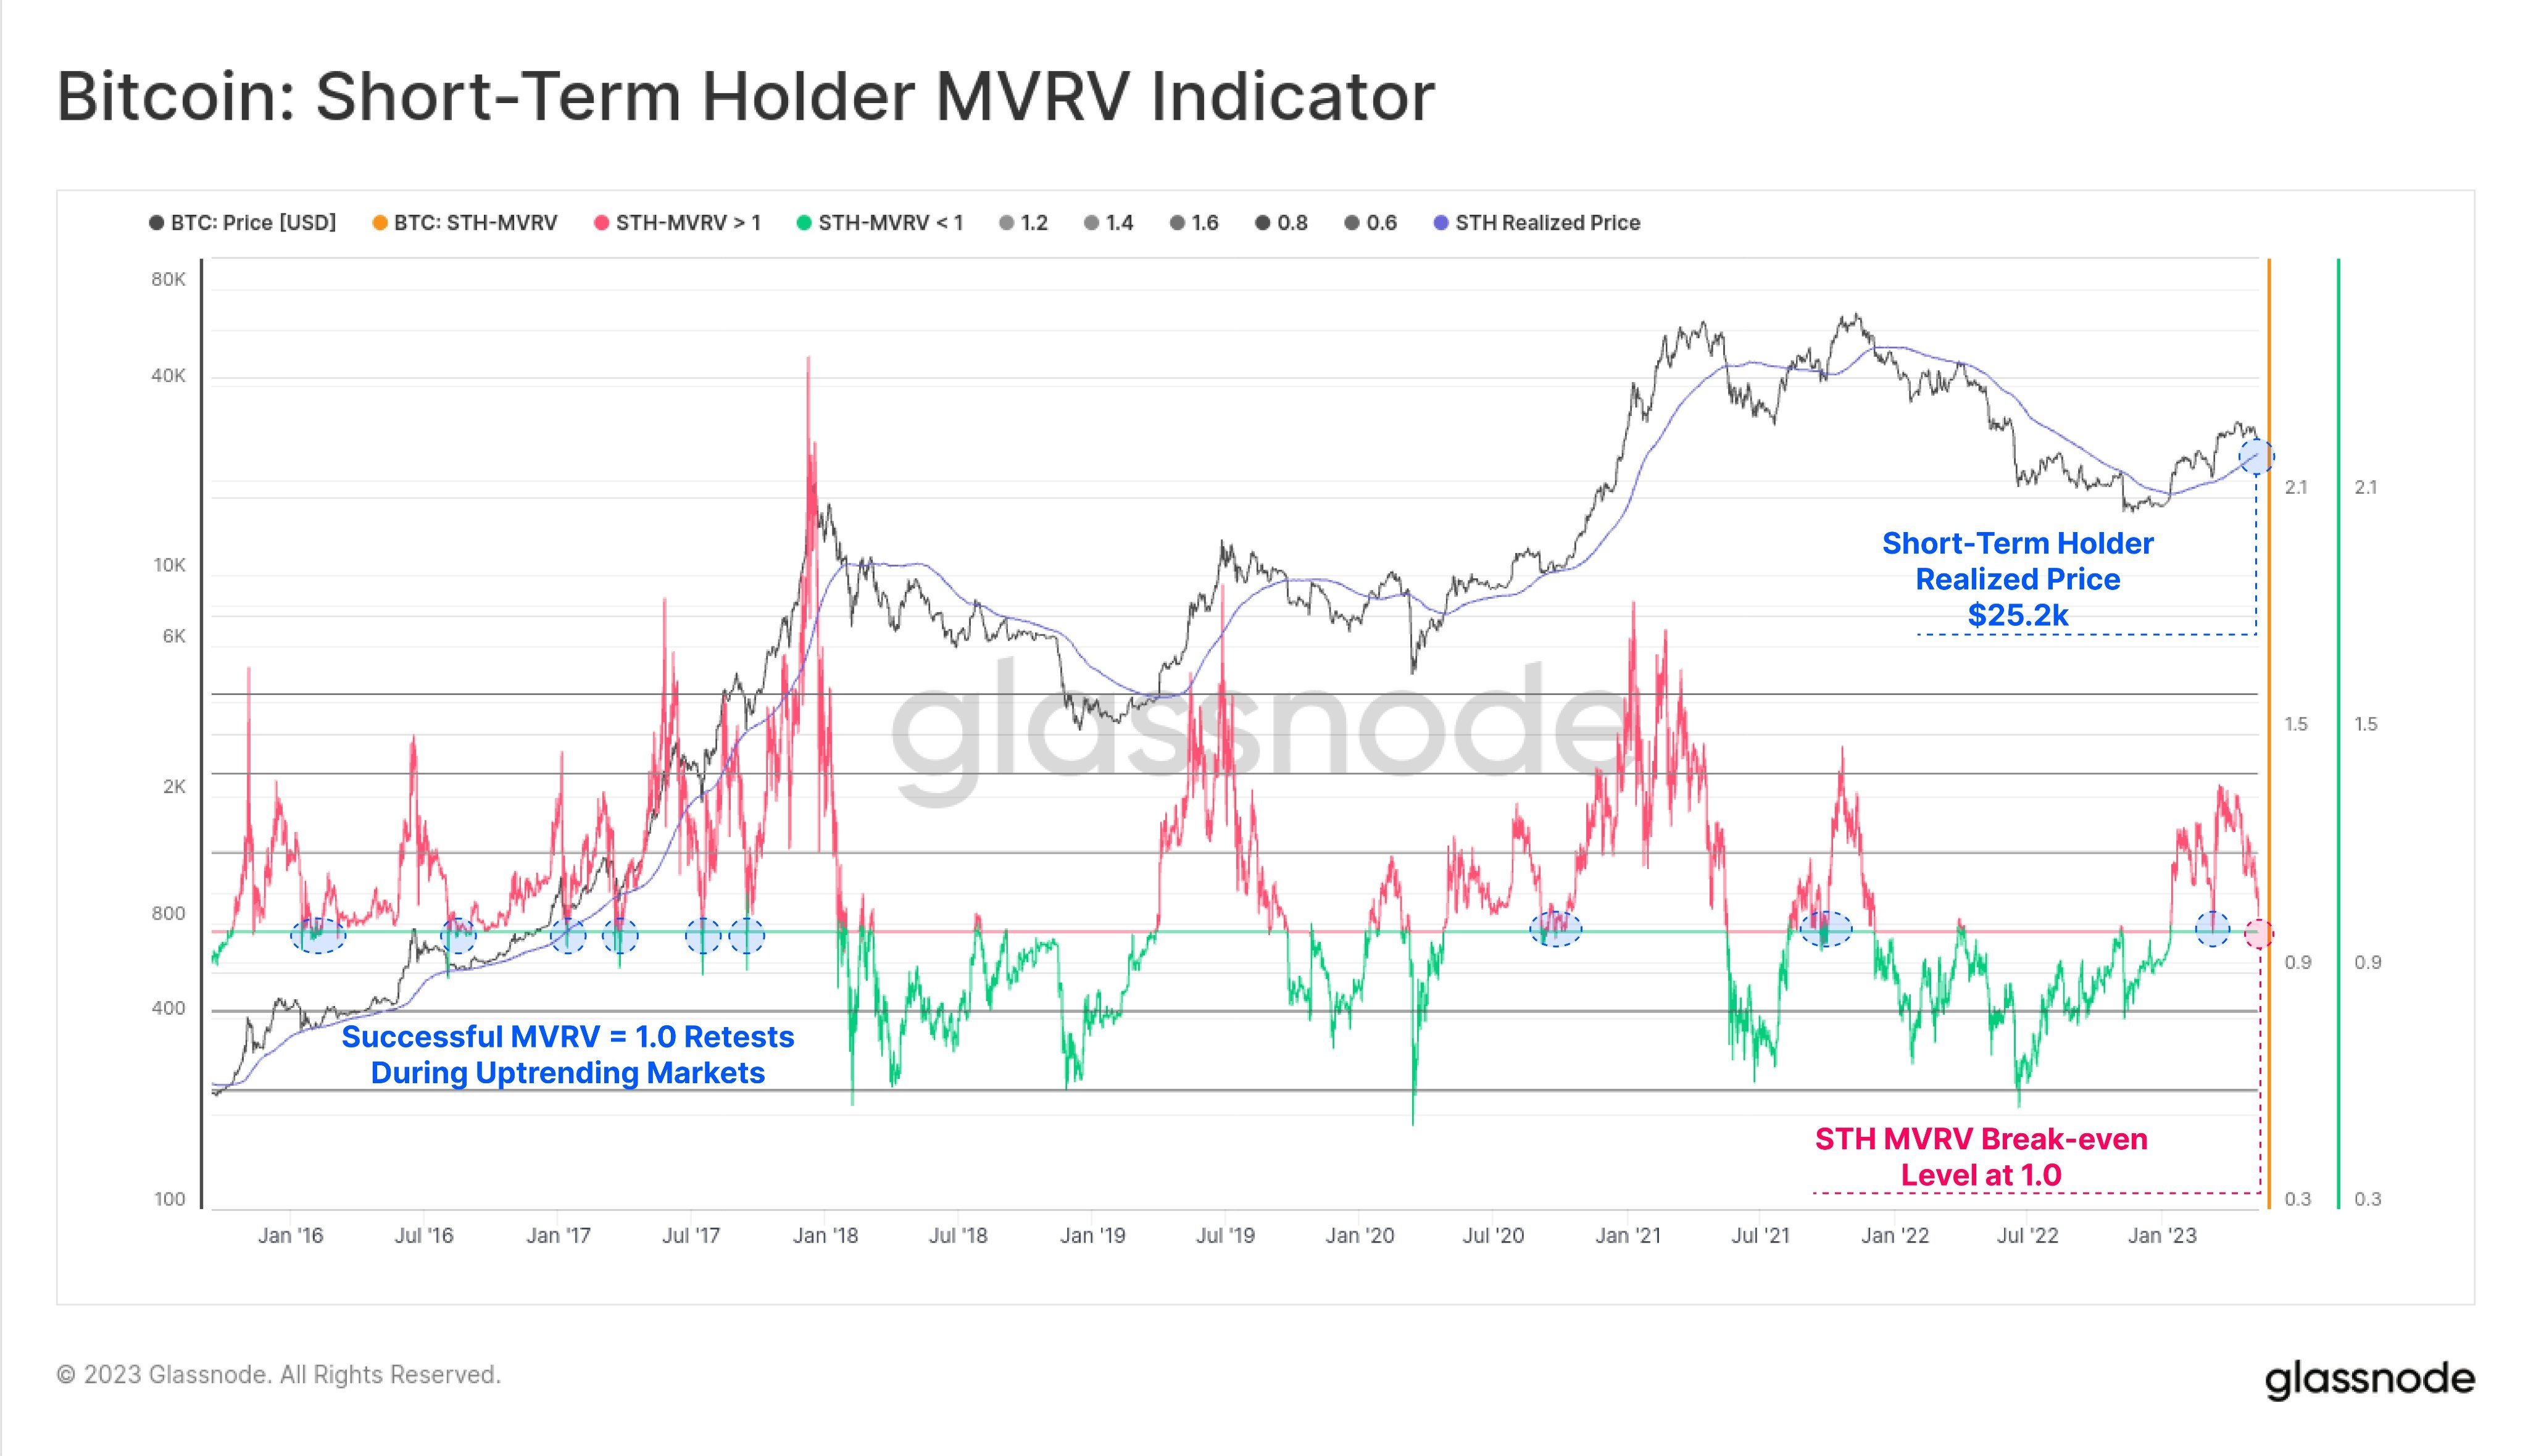
As for BTC, with its price continuing to fall lower in recent days, its STH-MVRV is dropping near to 1 again. During the early stages of the previous 2 bull market cycles, the price of BTC rebounded whenever the STH-MVRV dropped to around 1, while a reading of 0.9 always presented a fantastic buying opportunity. In the case of BTC’s current trajectory, a reading of 1 would translate into a price of around $25,200. Thus, how BTC behaves around this price in the event it gets there would be crucial to determine if we are in an uptrend or if its price has more room to fall. In March this year, there was a successful test where the price of BTC touched the MVRV reading of 1 and bounced; thus, another successful retest would put us in a good position to say that we are in an uptrend.
ETH Exchange Balance Ratio At All-Time-Low
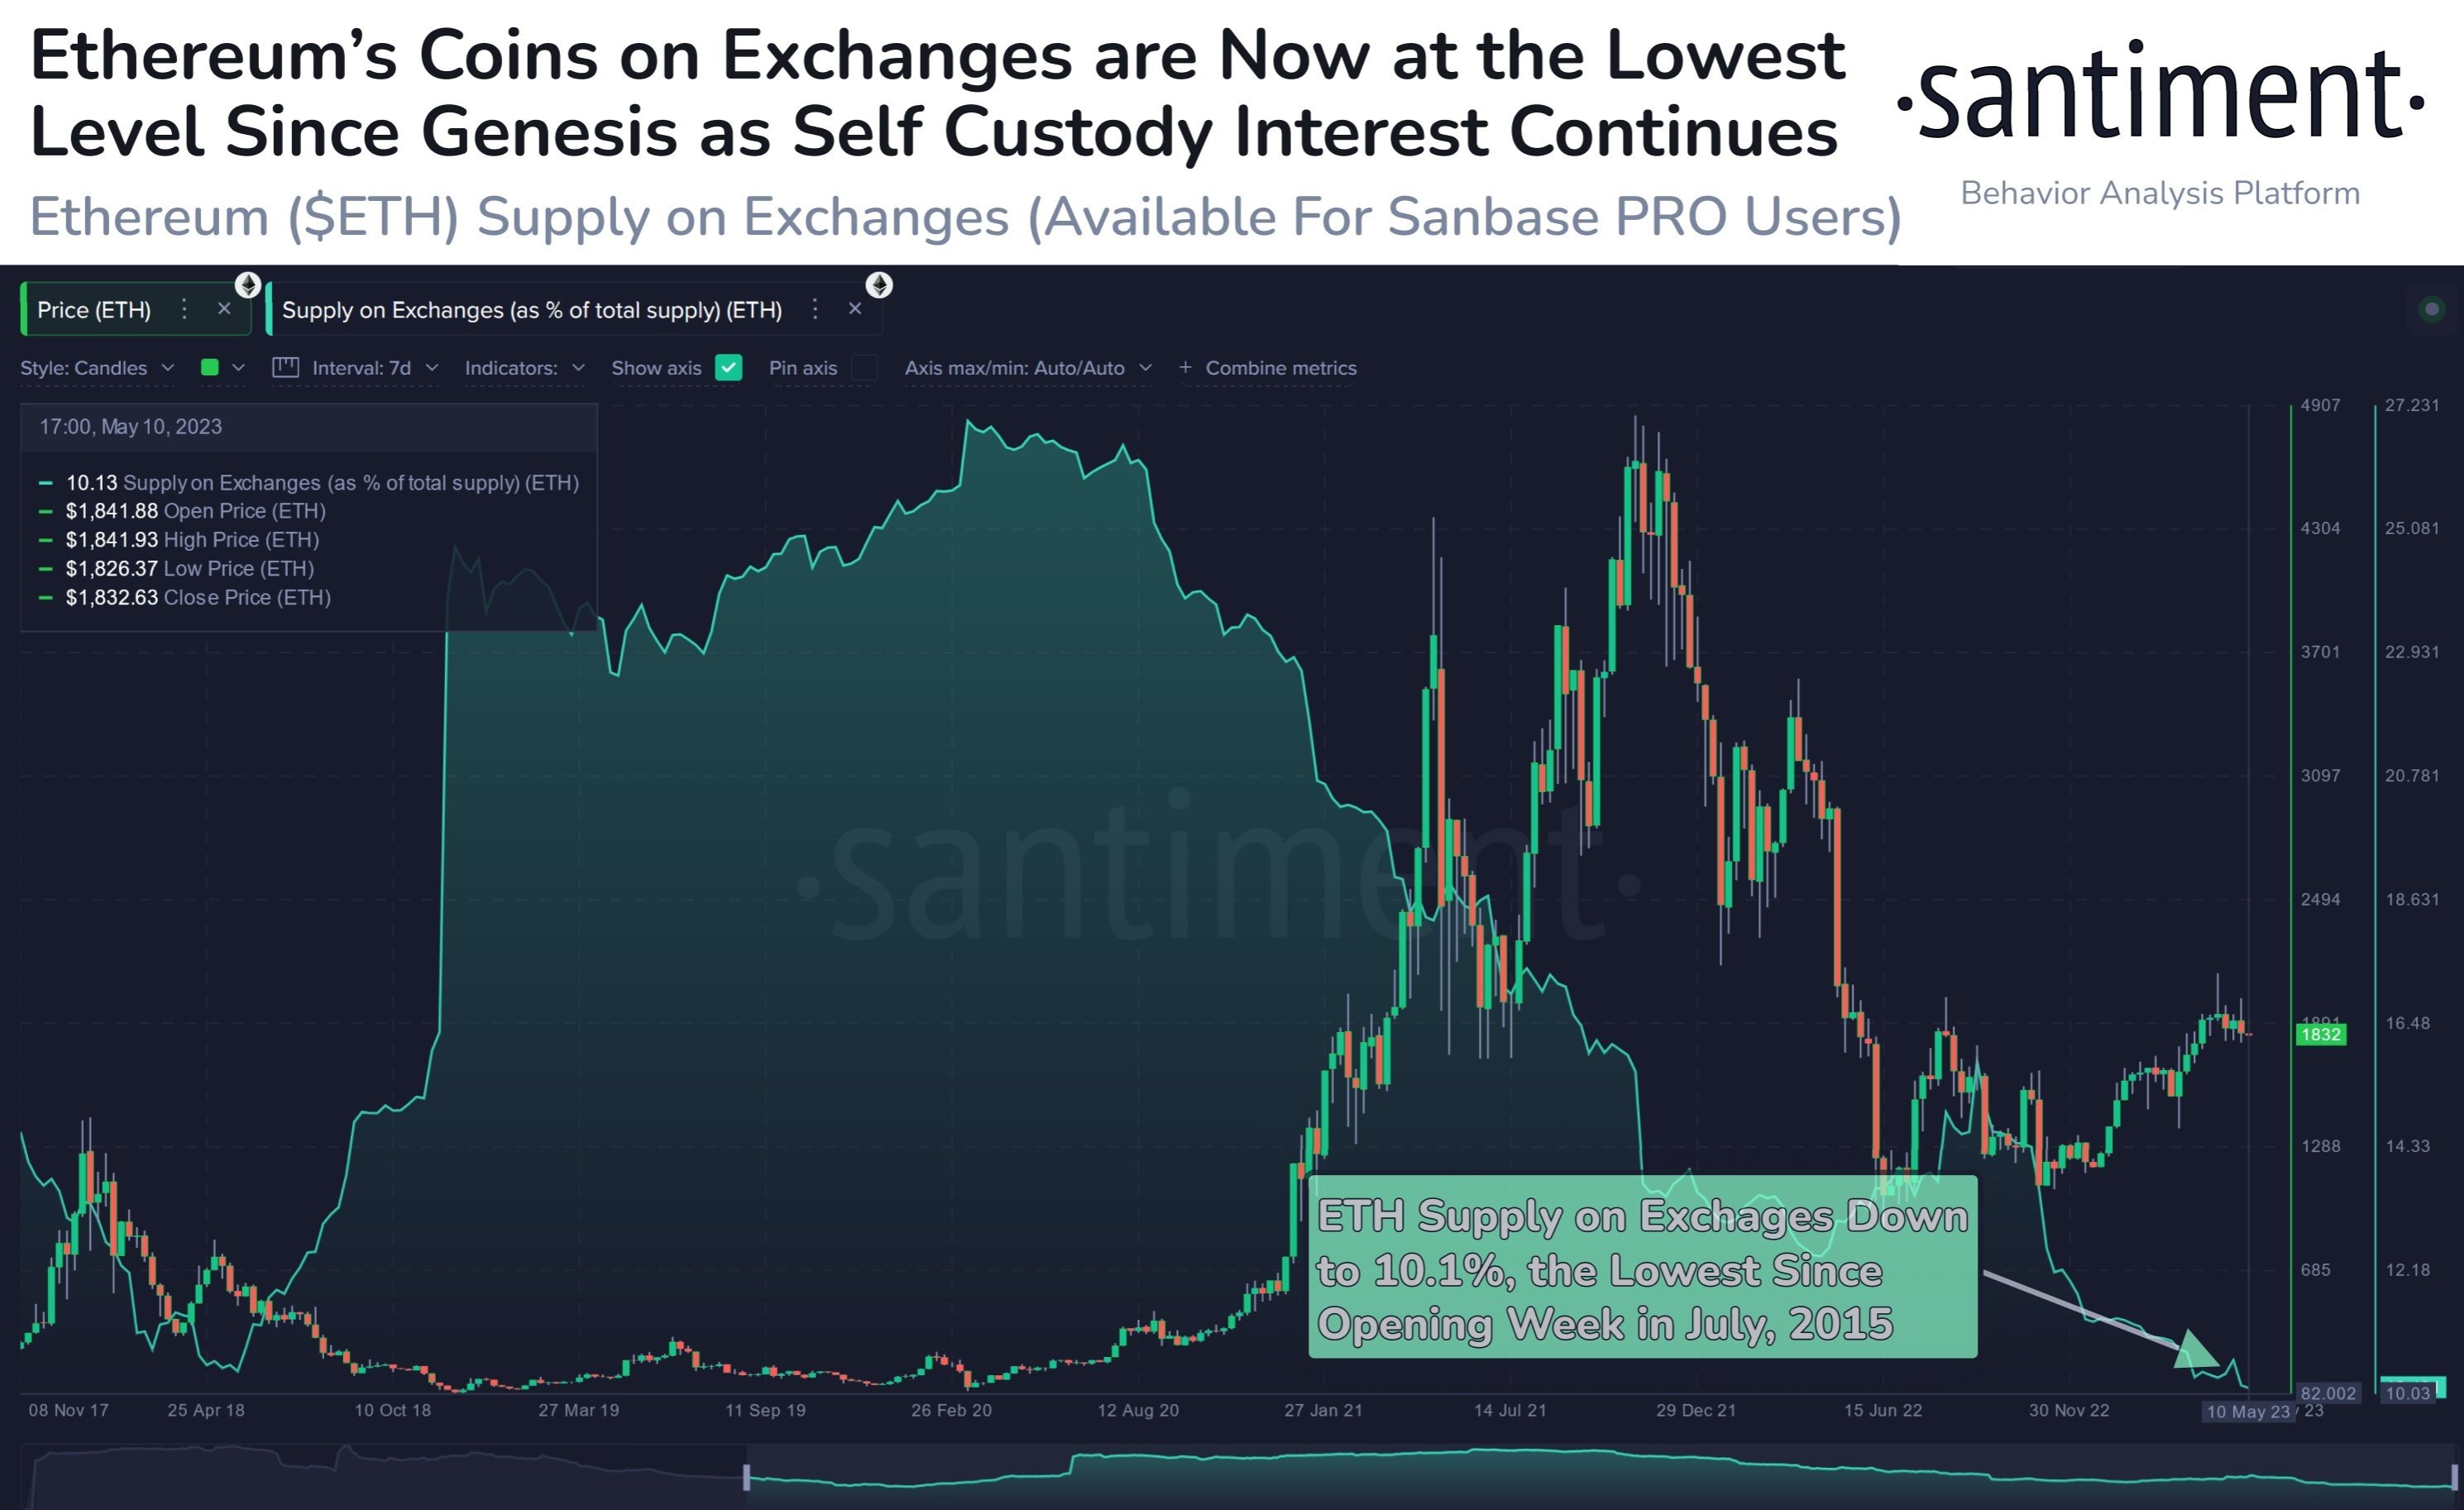
With regards to ETH, even though its price has been falling, its fundamental picture is not as bad as what its price is telling us. Other than a rise in its rate of deflation which would gradually reduce the circulating supply of ETH in the market, the amount of ETH balance on exchanges has actually started declining again last week, which means that the selling pressure on ETH is abating. Currently, the percentage of ETH on exchanges is at its lowest point of 10.1% since public trading began in 2015, while non-exchange holdings are showing an all-time-high. Thus, could ETH stage a strong rebound later on when most of the pending staking withdrawals have been redeemed?
Stocks Dip As US Economic Data Weaken
As for the traditional markets, last week saw the release of the US PPI data for the month of April, which grew by 2.3% year-over-year. Not only was this reading lower than the expected 2.5% and the previous month of 2.7%, it also hit a new low since January 2021, reigniting fears that the US economy is slowing down considerably. Furthermore, the consumer sentiment report out on Friday came in at a six-month low of 57.7 versus consensus estimate of 63. This showed that consumers were getting increasingly worried about the prospect of the US economy, especially when US President Biden’s meeting about extending the US debt ceiling, which Treasury Secretary Yellen said would be hit by 01 June, was postponed from Friday to this week.
The waves of uncertainty led key US indices to finish the week mixed, with the S&P 500 and Dow losing 0.29% and 1.11% respectively, while the Nasdaq gained 0.4%.
Fears of economic slowdown were exacerbated when data out of China showed that the Chinese economy was also slowing down – China’s CPI rose by only 0.1% year-over-year in April, while its PPI fell by 3.6% year-over-year to its lowest since June 2020 during COVID.
The lousy data out of China caused silver and oil prices to slip. Silver lost 6.5% last week while Brent Crude fell around 1.9%. The WTI fared slightly better, losing around 1.5%. Gold saw subdued action, having moved further away from the resistance at $2,080 to close at $2,010, down 0.25% for the week.
With the slowdown in China appearing to be worse than that of the USA, a flight to the dollar was seen across the board as worried investors sold risky assets like stocks and crypto into the safety of the dollar. As a result, the DXY rose 1.4%, dragging the EUR/USD and GBP/USD down 1.5% each even after the Bank of England raised rates by 25-bps last Thursday.
So far at the opening of trading this new week, activity is still slow in Asia and most assets are trading flat as at the point of writing. On the data front, we will see the US retail sales report out on Tuesday, while most eyes will be on Fed Chairman Powell on Friday when he speaks about monetary policy at the Thomas Laubach Research Conference in Washington. The markets could see volatility increase around the time of his speech, which is expected to be around 11am local time.
