The main story of last week continues to be cryptocurrency, which has outperformed all asset classes again by posting significant gains, albeit with all of the gains coming late Friday afternoon when the price of BTC suddenly surged by more than 7% after a brief pullback in the middle of the week.
Negative headlines about yet another bankruptcy had not managed to kill investor appetite just as we had predicted before, with investors shrugging off news of Digital Currency Group filing for Chapter 11 bankruptcy protection to reorganize its assets.
The crypto market did however, retrace a tad mid week to rid itself of excessive forth when the stock markets pulled back. As we had warned in our last report that the funding rate was getting excessive, a large proportion of traders began taking profits on their long positions. This profit-taking was the largest since February 2021 for BTC, and the largest since October 2021 for ETH.
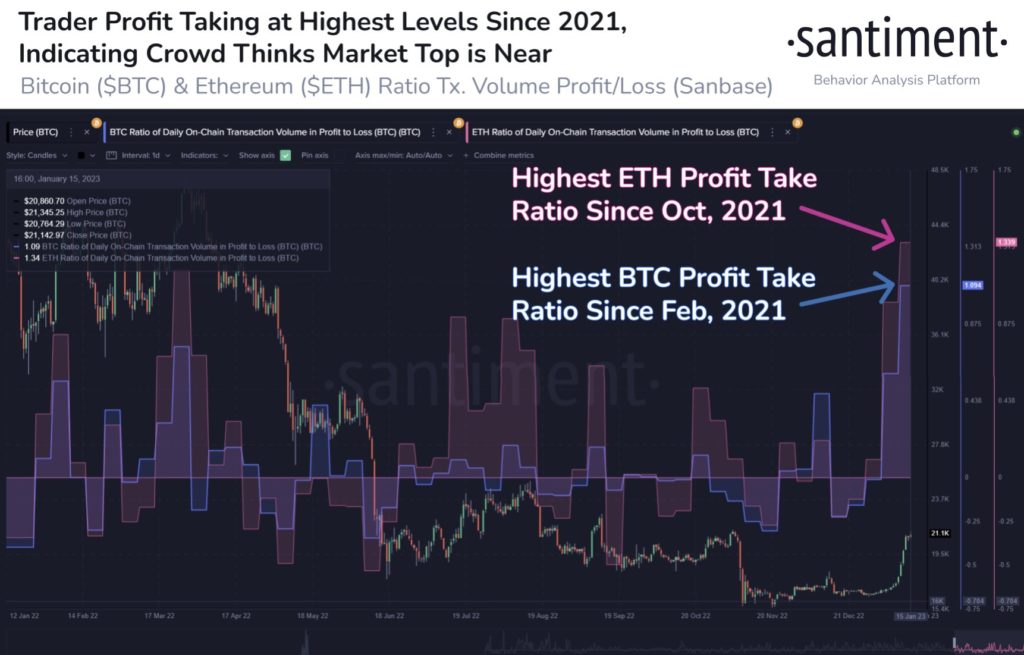
Regular profit-taking as prices move up could rid the market of excessive speculative activities which is a necessary purge to sustain a rising trend. The impressive part of the price action for both BTC and ETH last week was that despite the large amount of profit-taking, prices did not retreat but merely consolidated for a number of days. This shows underlying strength in the market, which could mean that prices could continue to be on a rising trend for more days to come.
The bullish implication on crypto is not only seen in the recent price action. Several onchain metrics have also turned bullish for the King of Cryptos – BTC, which will inevitably pull up the prices of other cryptos.
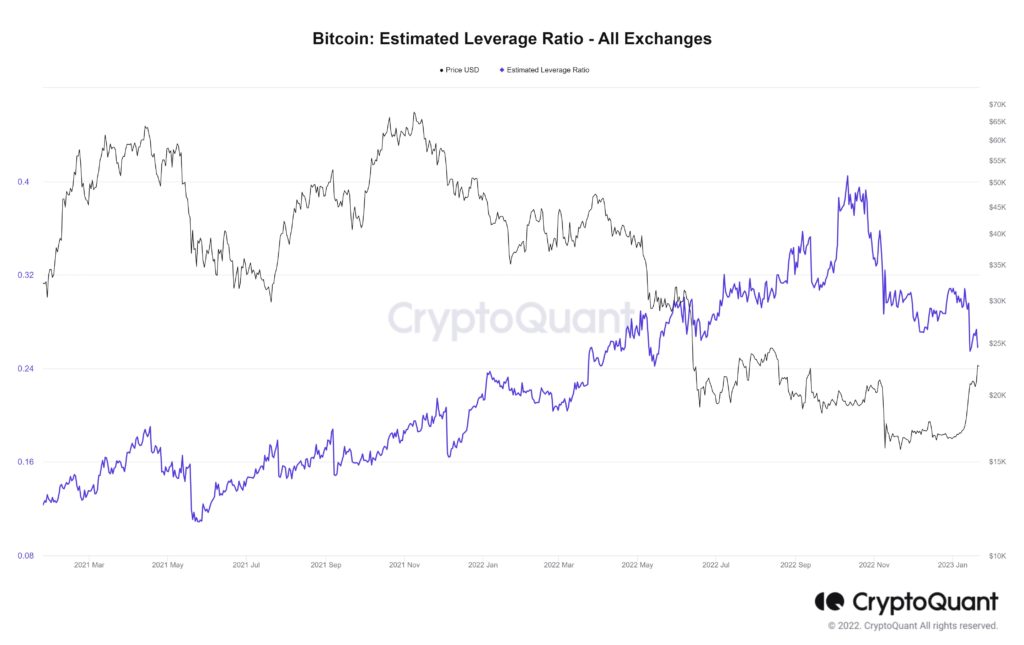
Recent Surge in Price Not Funded By Leverage
First off, from a short-term perspective, this recent surge in the price of BTC is not led by leverage. In fact, a check on the average leverage ratio in the market shows that the amount of leverage in the market has been declining even as the price of BTC has been surging, this proves that the surge in price is backed by actual cash inflow into the market, not by speculative monies. While the amount of leverage in the market is not low by any standard of measure, the fact that leverage is falling when price is climbing is a sign that the climb could be sustainable since it is backed by cash instead of speculative money. Furthermore, the drop in leverage with a simultaneous rise in price may also imply that much of the frothy retail speculators could have been caught on the wrong side, i.e. speculative retailer traders have been shorting the market and got liquidated. As speculative retail traders are typically a good contrarian measure, the fact that they have been shorting implies that the rally in BTC has room to go further.
BTC Metrics Suggests Rally May Have Legs
Other than short-term indicators, several long-term BTC metrics have also peeked above their trend change threshold, signalling that a bull market may be in the making should these metrics be able to maintain their newfound levels. We look at two such metrics below.
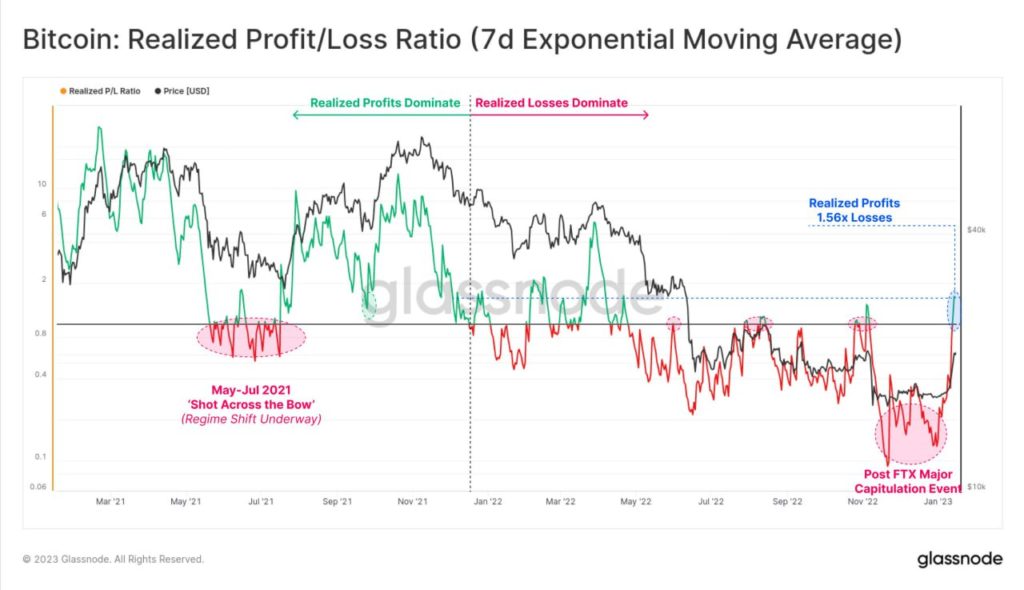
The first is the Spent Output Profit Ratio (SOPR), which calculates the ratio of short-term profit takers against loss cutting takers. For the first time since July 2022, BTC has seen a greater volume of profits realized on-chain than losses, as shown by the Spent Output Profit Ratio (SOPR) rising convincingly above 1, to a reading of 1.56 – the highest reading since July 2021.
In July 2021 when the metric rose sharply, the price of BTC rallied strongly upwards from $30,000 to $50,000 in the subsequent two months. While no one will know if this rally will eventually play out like the move in 2021, the recent sharp surge in the SOPR is worth paying attention to, especially when the consensus has been that this is a bear market rally to trap the bulls.
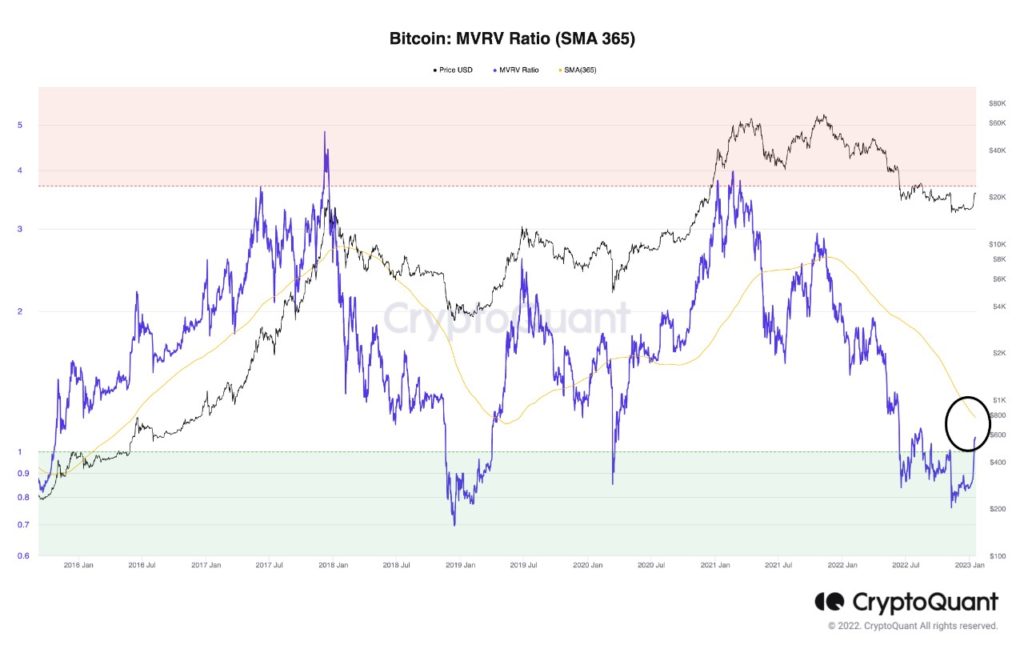
The next interesting metric is the MVRV, which measures Market Value Against Realized Value. Usually when market value is rising in respect of Realized Value, it is a sign of bullishness. For BTC, this metric has spiked significantly above 1 (to a reading of 1.07) currently after hitting a low of around 0.8 in November. Should the MVRV continue to trade above 1 in the coming sessions, it bodes well for the price of BTC to continue to move higher. A reading above 3 suggests that price is overvalued while a reading below 1 suggests that price is undervalued. MVRV rising is a bullish trend while MVRV falling signals a bearish trend.
Altcoins Clock Supernormal Gains As New Coins Outperform
As the two leading cryptos BTC and ETH stage commendable gains, newer altcoins have done even better, with newer blockchains like APT speeding off in its second week of 100% gains. For the month of January till date, APT has gained a magnificent 400% after having crashed from over $22 to a low of $3 in November. While such intense volatility may not be for everyone, almost every other altcoin has clocked immense gains over the past couple of days, with OP, the layer-2 roll-up on ETH network also putting in a 100% gain in just two days. ETH itself and MATIC, the other popular layer-2 on ETH, have also done exceedingly well, with gains of around 10% each over the week.
As long as the price of BTC and ETH continue to hold their ground at their newfound higher levels, rotation into different newer blockchain tokens that have been heavily flushed out due to the FTX saga could continue to chase the price of crypto higher as new discoveries about value are being made by astute investors.
As traders get tired of chasing the newest and hottest coins in town, old favorites could possibly come back into play this week, with rotational money possibly moving back into familiar old names. When such a situation plays out, old favorites like ADA, LTC, DOGE, SOL and even GALA could see the next round of interest.
Yen Weakens As BoJ Drops New Surprise
For the traditional markets, US stocks came back from declines in the middle of the week to keep major indices positive for the year 2023.
A disappointing retail sales number, coupled with a tamer than expected PPI release on Wednesday initially soured traders view, with most beginning to take profits on whatever gains they had from the first two weeks’ of rally as a series of weaker data reminded investors of the impending recession ahead. Large job cuts from Microsoft and Google also did not help matters. However, a better than expected future guidance from tech companies like Netflix late in the week managed to buoy investor confidence, with them now seeing major job cuts as a sign that companies are actively trying to manage their bottom lines in the midst of a more difficult landscape.
The Nasdaq was the outperformer for the week, posting a 0.55% gain and its third positive week in a row. The Dow finished the week lower by 2.70%, and the S&P posted a 0.66% loss, both breaking two-week win streaks.
After hinting to the markets in December that it would amend its yield curve control (YCC) range, the BoJ shocked markets by maintaining the scheme in its monetary policy meeting early Wednesday Asia time. This led the yen to an instant drop of more than 2% against its peers, sending the USD/JPY up 300 pips from around 128 to above 131 in a jiffy.
However, traders soon decided that the lack of change in this meeting was simply a one month delay of the inevitable rise of the YCC range and began to buy the yen again. Even worse, as soon as the US markets opened on Wednesday, traders soon faded the entire intraday rise of the USD/JPY back down to 128 after a tamer than expected PPI further gave traders the sign that inflation would be slowing. As of the close of market on Friday, the USD/JPY was in the mid-point of the week’s move, at around 129.60.
Even though the USD/JPY managed to recoup some losses from last week, the move did not help the US dollar very much as the DXY was still reeling at around 101.60 as US yields started to decline on the back of timer inflation expectations and worsening economic data. The yield on the benchmark 10-year Treasury has fallen from December’s 3.9% to around 3.48% currently.
The weaker dollar is supporting precious metals, with Gold and Silver rising about 1% each, while Oil continues to inch higher as China’ reopening provides oil traders with optimism about demand for oil going forward. For the week, Brent and WTI Crude have each gained by about 2%.
As we are in the Lunar New Year period which is celebrated by at least one-third of the world population, markets will be closed on Monday and Tuesday in most Asian regions and trading activities are expected to be quiet for the remaining days of the week.
Over in the USA, even though it does not celebrate the Lunar New Year, this week’s economic calendar is pretty quiet, with only two major event risks. The first will be the advance GDP number set for release on Thursday, while the other event risks being the PCE numbers to be released on Friday. However, with the CPI numbers already steadily declining for the past few months, the upcoming PCE number is not expected to spring any surprises. On the currency front, the Bank of Canada will be meeting to discuss its interest rate move on Wednesday.
