US stocks closed weaker in the holiday-shortened Easter weekend after the March inflation report released on Tuesday came in a tad higher than expected, with the CPI up 8.5% vs consensus expectation of 8.4%. Supplier prices were also hotter than expected, with the PPI gaining 11.2% from a year ago and marking the biggest gain on record going back to 2010.
The S&P 500 dropped 2.13% for the four-day trading week, while tech-heavy Nasdaq lost 2.63%, and the Dow closed down 0.78%.
The greenback was stronger all week, with the DXY trading above 100. Treasury yields thus climbed higher, with the benchmark 10-year US Treasury yield rising back to multiyear highs, climbing 13 basis points to top 2.8% by the close of Thursday.
Rising rates are not just a thing with the USA as the UK and New Zealand had already started rising rates, and while not raising rates as yet, the ECB confirmed that it will conclude its net asset purchases in the third quarter after the EU’s inflation hit a record high of 7.5% in March.
After the initial knee-jerk reaction to the IEA release of oil reserves, oil prices recovered to post significant gains last week after the IEA warned on Wednesday that roughly 3 million barrels per day of Russian oil could be shut in from May onwards due to sanctions or buyers voluntarily shunning Russian cargoes. EU nations are voluntarily curtailing Russian energy imports effective May, which could intensify supply shortage of oil to these nations, thereby sending the open market price of oil higher. As market participants re-adjust their positions to account for the new situation, Brent rose 9.8%, while WTI Crude gained 9.1% last week, and is opening the new week higher by a further 1%.
Inflation pushes oil up, use itEven though market action was a lot more subdued when compared with Oil, precious metals nonetheless rose in spite of a rise in the USD, suggesting that other fundamental reasons could be at play with it comes to the safe havens. For the week, Gold rose 1.2%, while Silver gained 2.65%. The new week sees both metals trading around 0.7% higher.
The other perceived safe haven, cryptocurrencies, though, did not have the strength of precious metals as the selloff in tech stocks have negatively impacted traders’ impression on cryptocurrencies even though the two asset classes do not have much in common.
BTC thus fell 7% on Monday as tech stocks across the globe came under selling pressure, and could not manage to hold on to a small technical rebound mid-week after the LUNA foundation announced that it had bought another 2,500 BTC on Wednesday. Even though BTC price did not rebound, it nonetheless spent the rest of the week off its low and was consolidating around the $40,000 level. This weakness in BTC price is spilling over to altcoins, who have spent the week hovering near their lows made in the week before.
However, as the new week begins in Asia, contagion from the falling stock market in Asia has sent crypto prices lower again, with BTC breaking below the psychological level of $40,000.
Traditional Finance Causing Weakness In BTC
The recent trajectory in BTC’s prices has been puzzling to some crypto native investors as geopolitical tensions in the past usually saw a stronger BTC. A check on a few metrics seem to suggest that the current lacklustre BTC price action could be a caused by traditional finance traders who take short-term momentum trades. We examine a couple of traditional finance influences below.
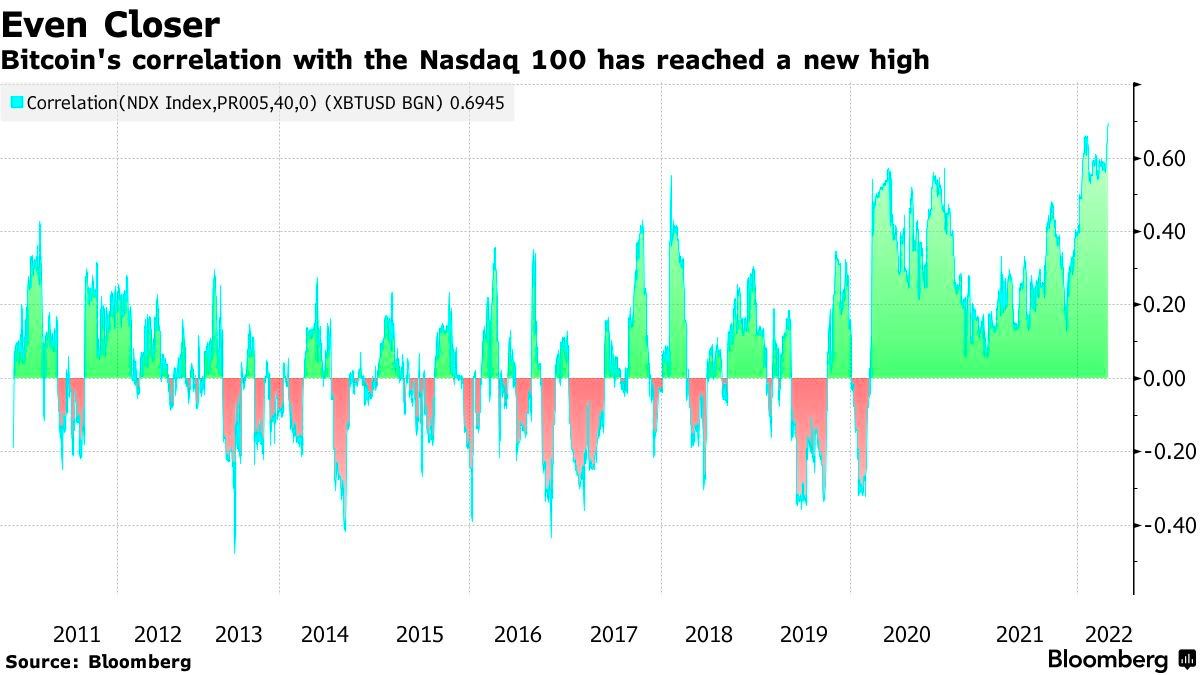
For one, BTC’s correlation with the Nasdaq has hit a new high, as such, the unwinding of tech positions is causing traders to dump BTC as well. It is worth noting that the price of BTC has from 2013 been inversely related to tech-stocks until the COVID dump-and-pump of 2020. While the correlation is high now, it does not necessarily guarantee that this relationship will remain the way it is now. Notice in the diagram that before 2013, BTC also had a positive correlation with the Nasdaq which subsequently decoupled and turned negative.
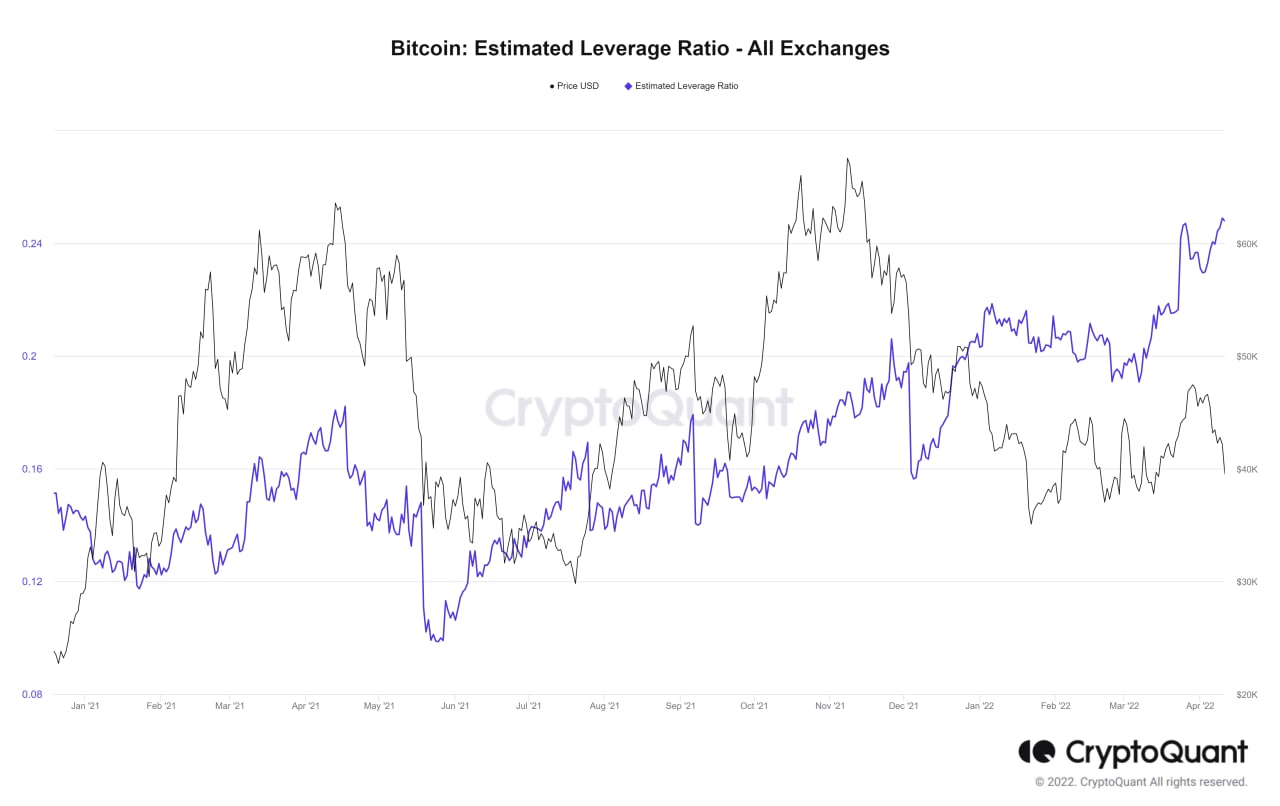
Another popular method of trading that is heavily utilised by traditional finance traders is leveraged trading. As can be seen in the chart below, BTC’s leverage ratio has broken yet another ATH early last week when the price of BTC went below $40,000. This could imply that most of the leverage trades were on the short side as the ratio continued to hover at the highest levels despite BTC price having caved more than 18% from a week ago. Had those positions been long trades, the ratio would have started to decline as the longs get liquidated.
Crypto natives typically do not practice much leverage trading on centralised exchanges as even the most degenerate of them do it on DEXes, which is not recorded in the below chart.
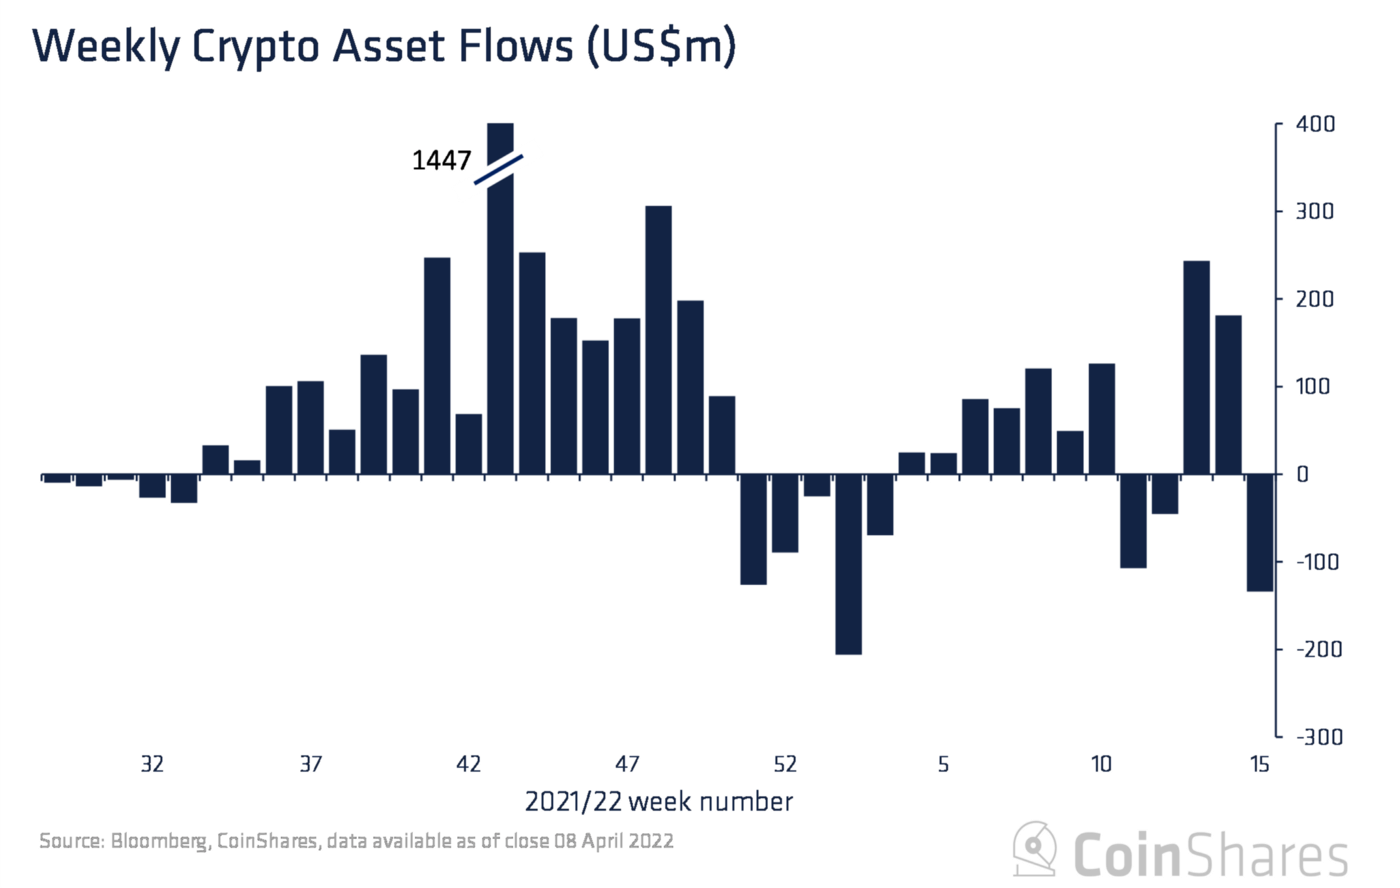
Another group of traditional finance investors that could have sold are the crypto fund products, which saw outflows totalling $134 million last week, marking the second largest weekly outflow this year.
BTC bared the brunt of the outflows, which totalled $132 million and even saw a $2 million flow into short BTC investment products, its largest inflow on record. Collective-investment funds are typically structured for traditional finance participants.
BTC Whales Accumulating More Aggressively
Despite traditional finance traders possibly selling BTC due to bearishness on tech stocks, crypto native whales are mopping up whatever these newer crypto investors are selling recently, as can be seen in the jump in whale wallet balance of BTC holders with more than 1,000 BTC.
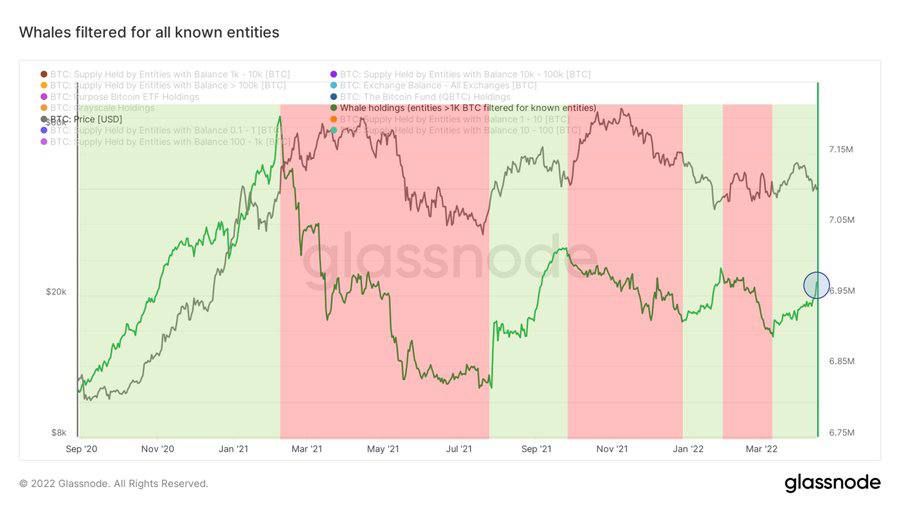
At the same time, on Friday, a single transaction of 29,400 BTC was withdrawn from an exchange. Speculations are rife that this withdrawal happened at Coinbase Pro.
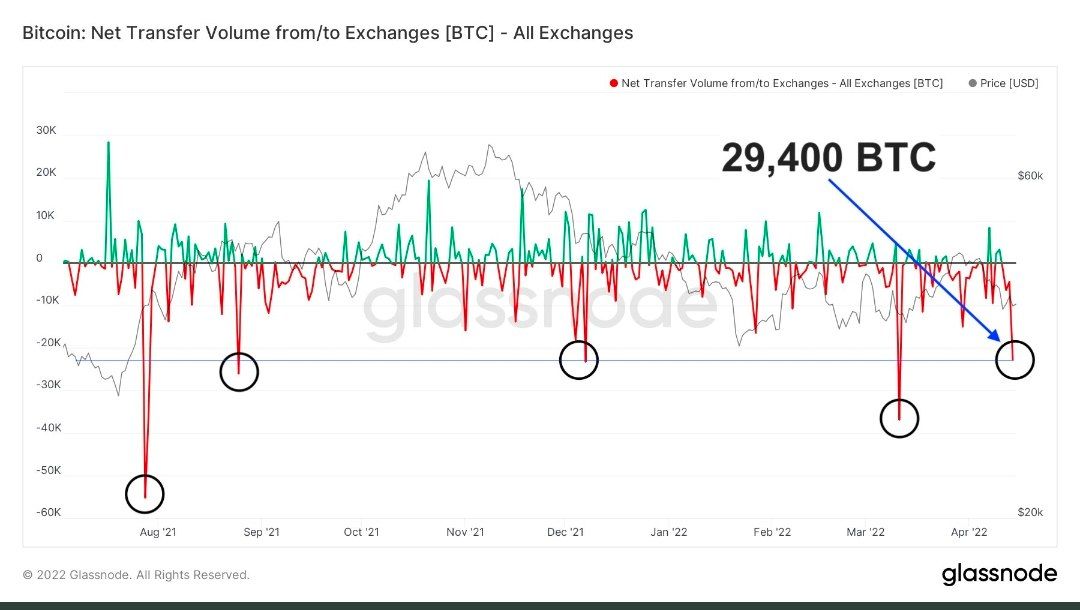
As a result of these recent buys, the BTC net position change is showing one of the highest numbers of BTC withdrawn from exchanges in recent times. Only 3 other occasions have we ever seen this much BTC withdrawn from exchanges at this rate. In the past 3 occasions, the price of BTC rallied in the weeks and months afterward.
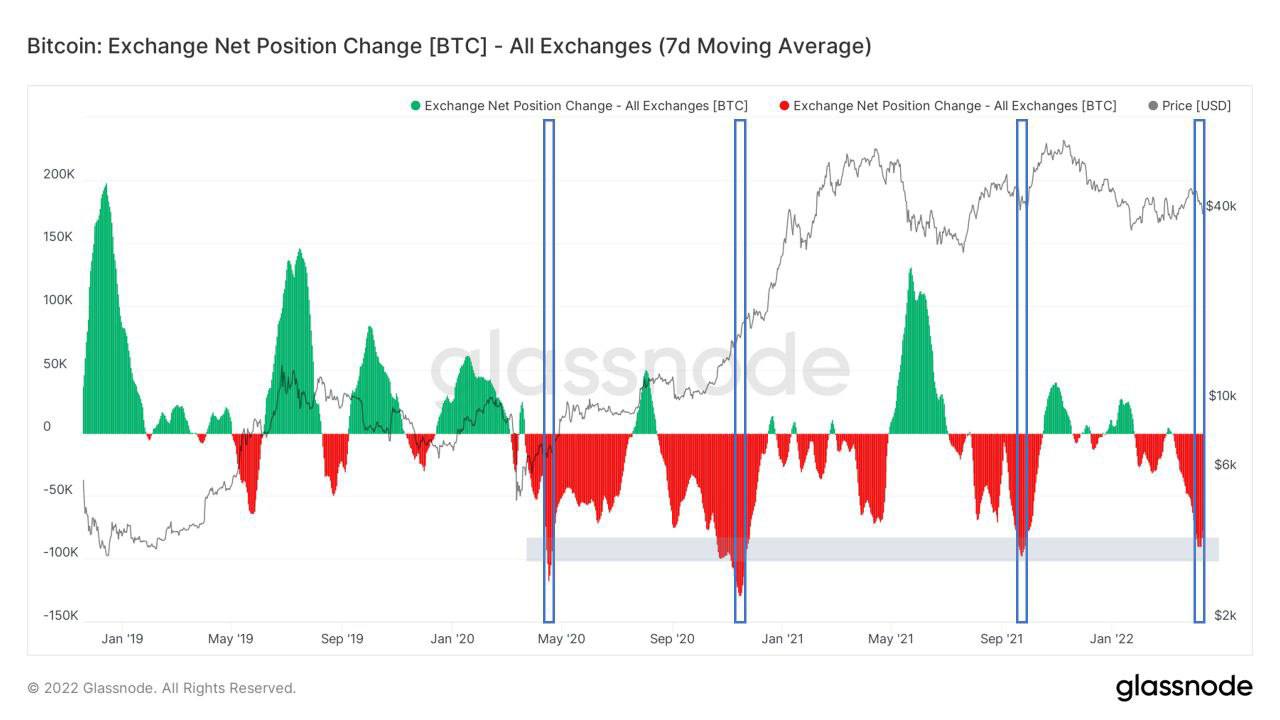
Hence, looking at the above information, one can see that while the price of BTC looks weak, on-chain activity appears to be giving a different signal.
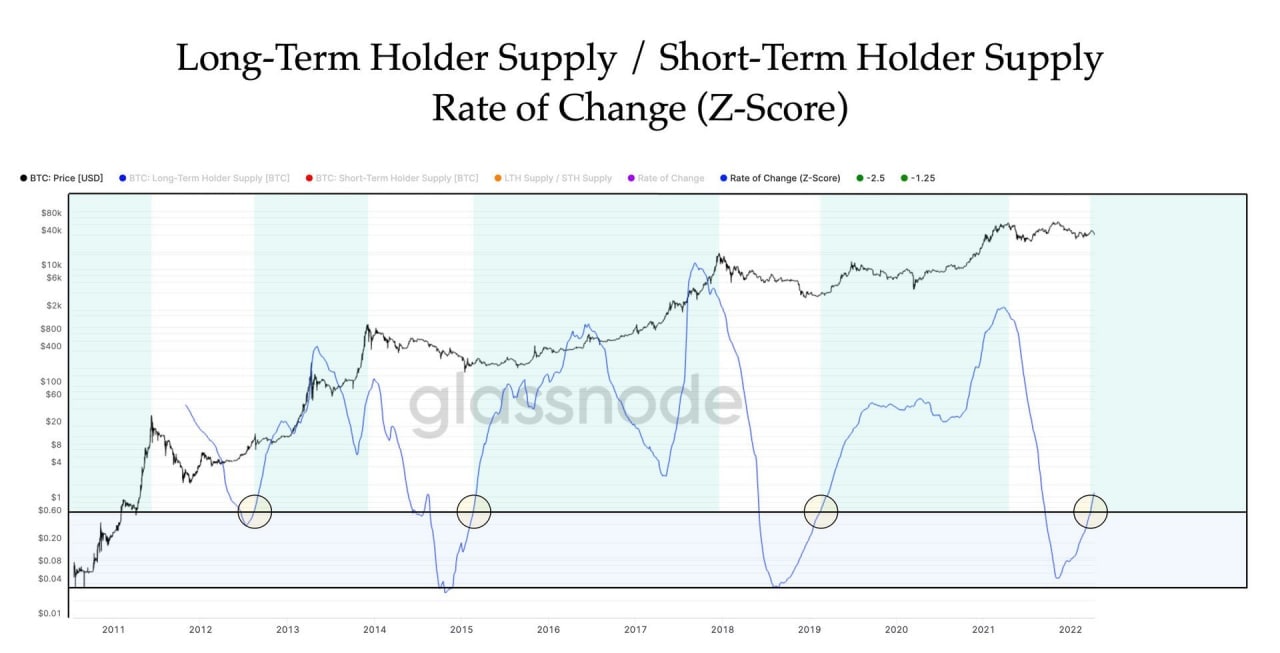
One particular metric, the Z-score, is even giving out a bullish signal. From the below diagram, one can see that the BTC Z-score has bottomed out and is on an uptrend. This only happened 3 other times in the past and each time after Z-score turned up, a new uptrend in the price of BTC followed.
Two Legacy Tokens Shows Underlying Strength
Although most altcoins had a quiet week of consolidation while BTC was trying to find a bottom, two older coins from the early crypto days showed some interesting activities. The first was LTC.
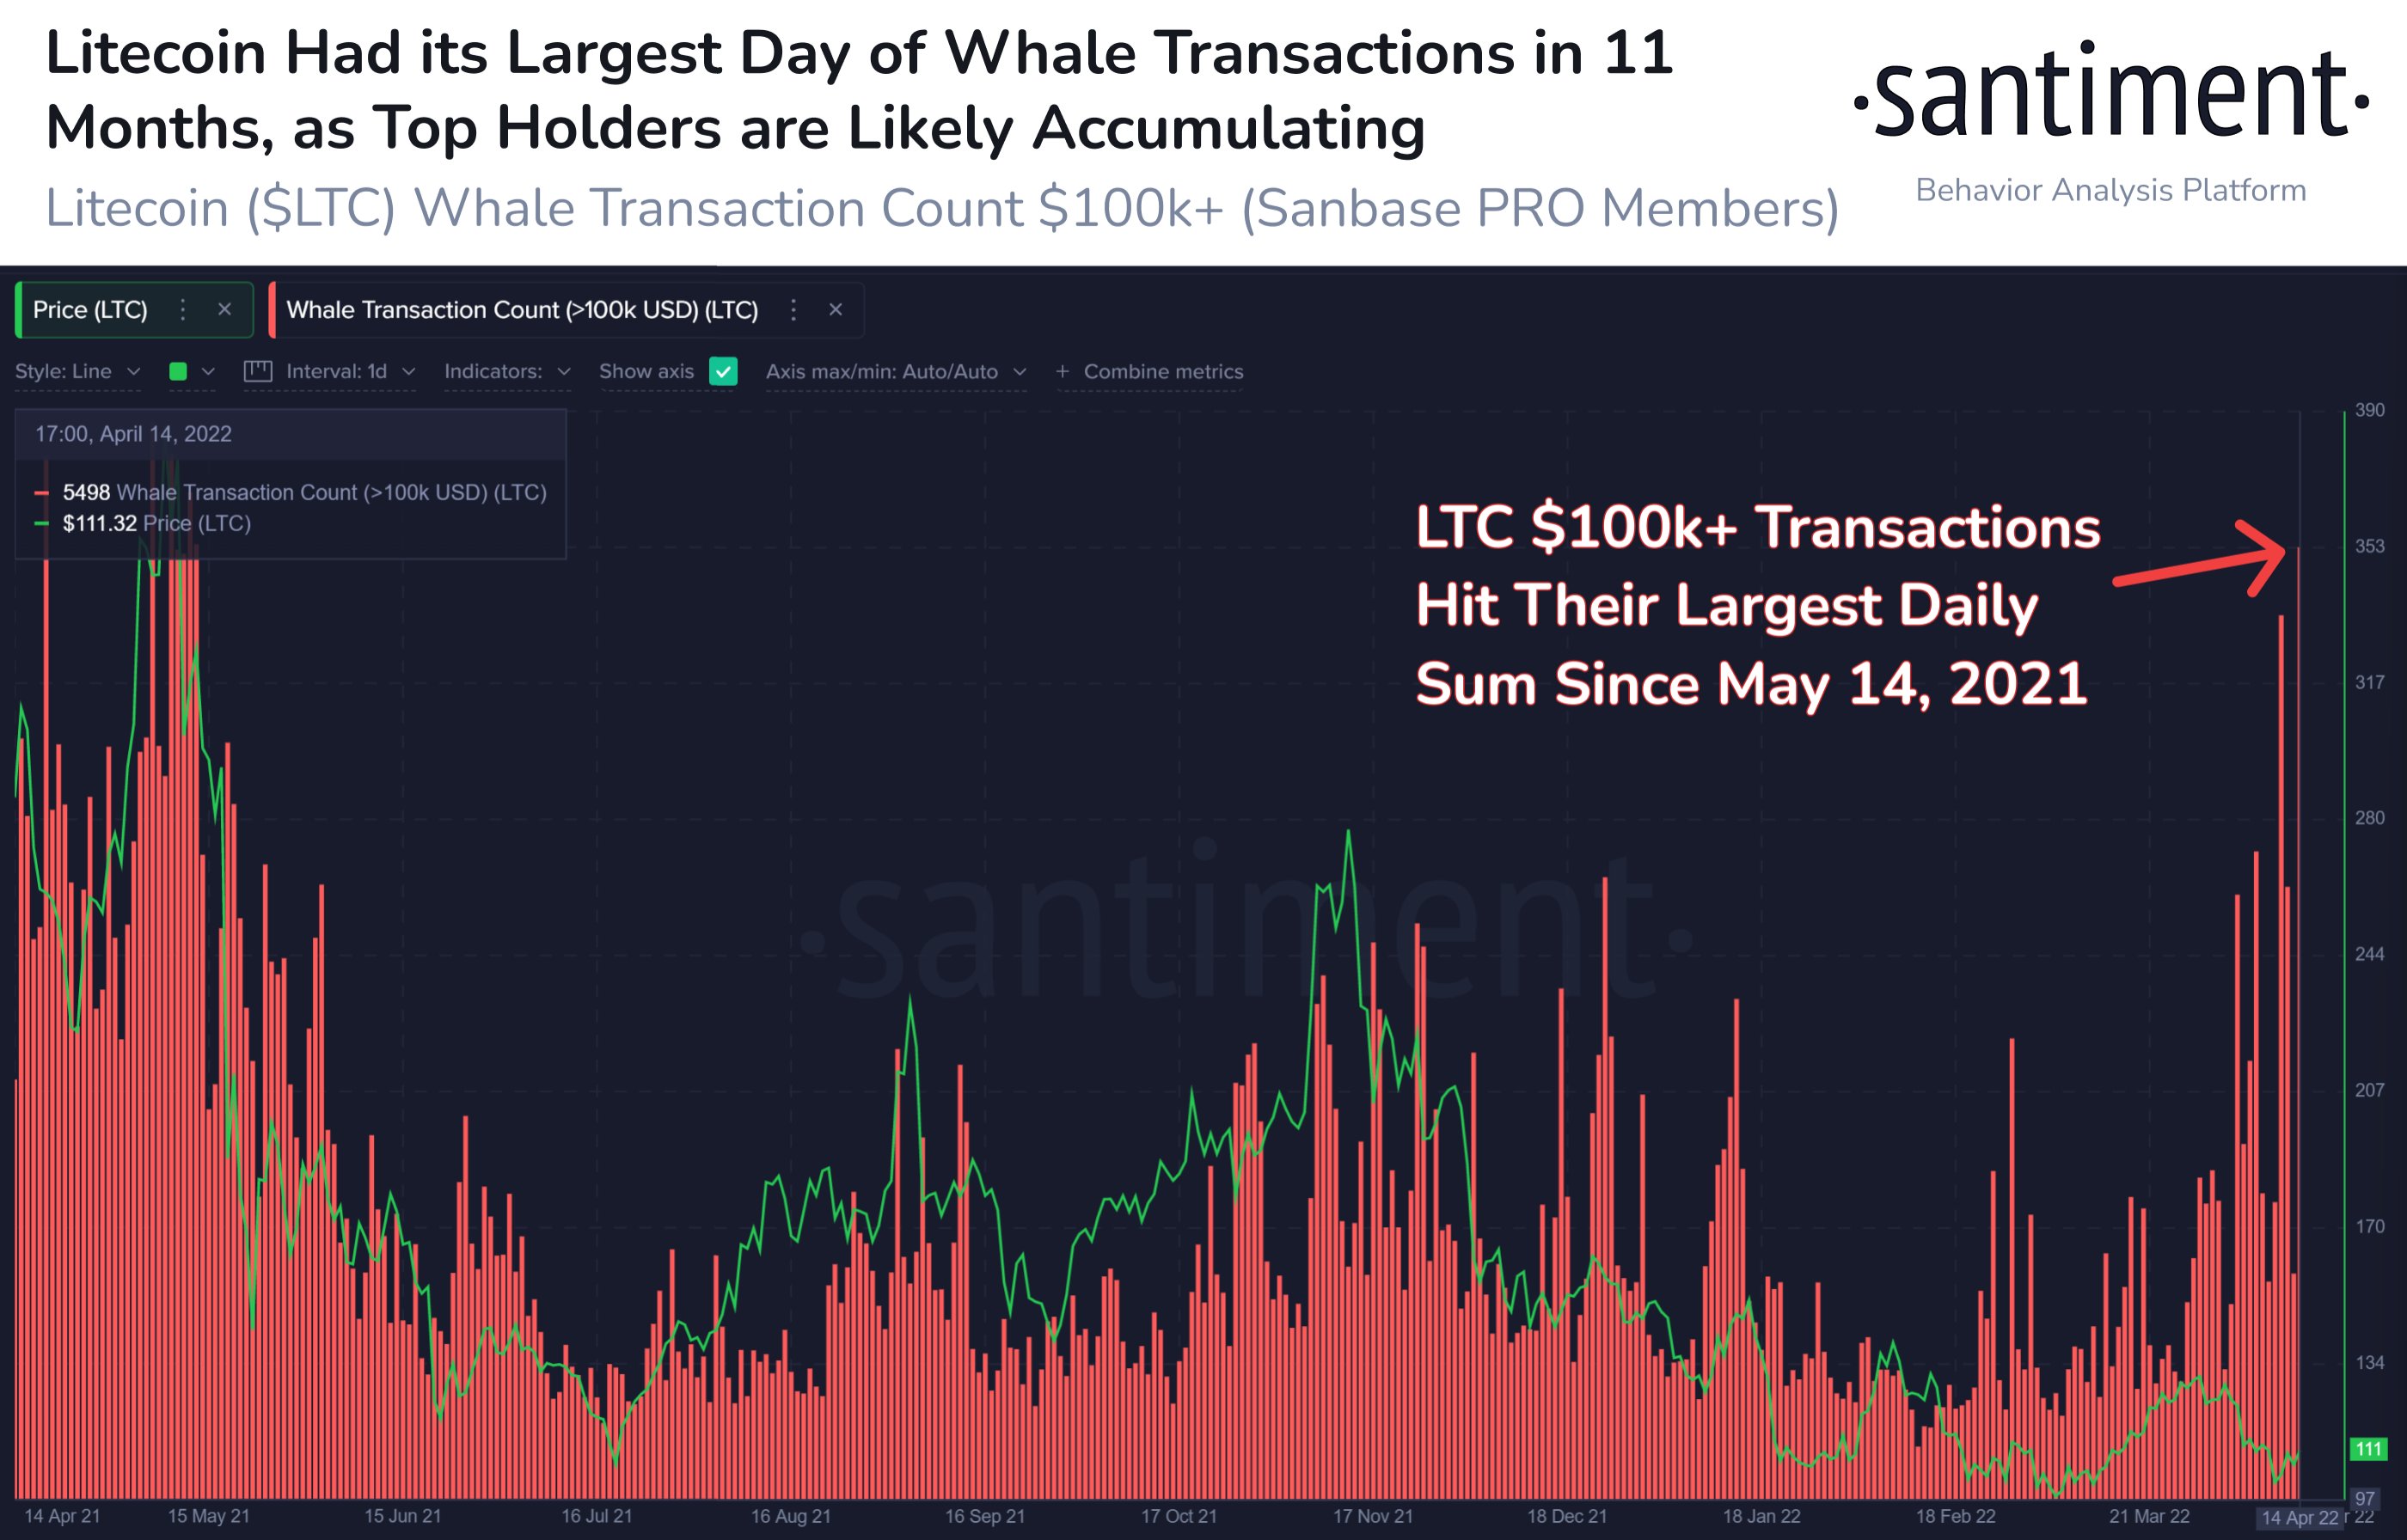
Following our previous observation on increasing whale accumulation on LTC, last week continued to see large transactions on the LTC network. In fact, Thursday saw the highest transaction volume in 11 months of 5,508 LTC recorded on the network, while activities were also at an elevated level all through the week, a sign that a lot of whale transactions were occurring. In the past when such large volume accumulation occurred, the price of LTC popped in the weeks after.
Another legacy token which saw a surge in activity last week was XRP, which have seen regular pumps over the last two years as “small wins” in the Ripple lawsuit often led the community to pump up the price of XRP. This time was the same, with the price of XRP surging after Ripple CEO Brad Garlinghouse revealed in an interview with CNBC that the lawsuit with the SEC has gone exceedingly well for Ripple. However, as the broad crypto market dropped again to start the new week, XRP has pulled back in tandem, giving traders who have missed out previously an opportunity to pick up some of the token at a good price.

