The act of purchasing and selling currencies with the intention of making money is known as Forex trading, often referred to as foreign exchange trading. Through online trading platforms or brokers, traders can purchase or sell currencies depending on how they anticipate their value will fluctuate in comparison to other currencies. Forex trading involves the exchange of currency pairs like EUR/USD, GBP/USD, and USD/JPY and is done five days a week, around-the-clock. Profiting from the fluctuations in exchange rates between currency pairs is the aim of forex trading. Although it can be risky, Forex trading calls for a solid grasp of the market environment, technical analysis, and risk management techniques.
In Forex trading, trend lines are lines that connect two or more key price points on a price chart, indicating the direction and force of a trend. On a price chart, trendlines are created by connecting the higher lows during an uptrend and the lower highs during a downtrend. With the aid of the trend line, traders may more easily see the direction of the market as well as potential places of support or resistance. The breaking of a trend line might indicate either a potential trend reversal or the continuance of the present trend. Trend lines are frequently combined with other technical analysis tools and indicators by investors to help them make well-informed trading decisions.
Trend lines are one of the most followed tools for Forex investors, and therefore, it is important to understand how they work. There are three trend line patterns that we will talk about in this article, and discuss the importance of each trading line.
Understanding Trend Lines
On a Forex chart, trend lines are lines that connect two or more important price points and show the direction and force of a trend. Because they assist players in the markets in determining the present trend and prospective points of support and resistance, they are crucial tools in technical analysis.
To evaluate the market and identify entry and exit locations, trend lines are used. By drawing trend lines, you can gauge where the Forex market is heading. A trend line is created by joining the higher lows in an upward trend, and the lower highs in an upward trend. A potential location of support or resistance may be indicated when the price approaches a trendline.
Additionally, a trend line can be used to spot future trend reversals in the Forex market. When a trend line is broken, it could be a sign that the trend is shifting. Forex Trend lines are frequently combined with other technical analysis tools and indicators by speculators to help them make well-informed trading decisions.
Trendlines can be an uptrend line, a sideways trend line, and a downtrend line. These all show an area where price refuses to go, showing traders where the market sentiment is.
Uptrend Lines
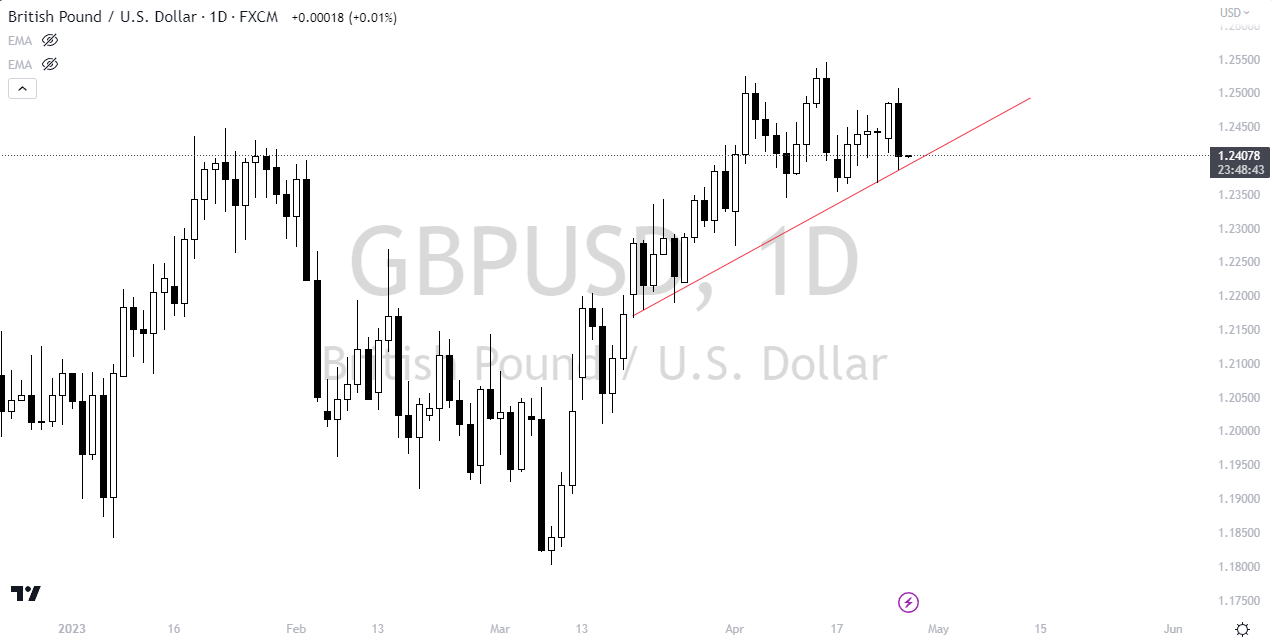
Notice the trend line on the chart above, its an uptrend line.
An asset or security’s price is rising over time while the pair is in an uptrend. As buyers control the pair and drive prices upward, this scenario is defined by a string of higher highs and higher lows in the price movement. A trend line is oftern used for visualization. You can draw trend lines to show spots where the market conditions are supportive.
An uptrend line tends to be the first thing that speculators are comfortable with when it comes to trading, but remember that most trend lines are arbitrary at first, but are considered “normal” by those coming from other markets. Investors and speculators tend to like daily charts and Forex trend lines that last for a long time, as they have the confidence of the market behind them, as they identify levels that are obviously. This is what most stock investors call “trend trading.”
Downtrend Lines
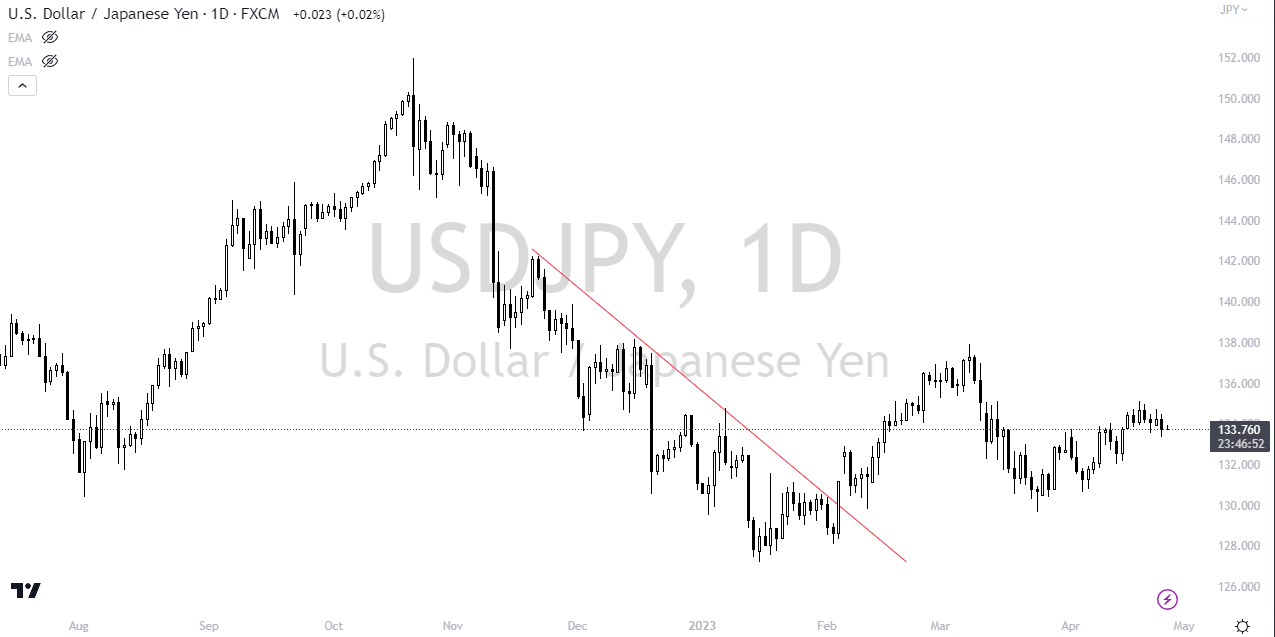
Notice the trend line on the chart above. (Down trend) It also shows a break above it eventually.
When a market is in a downtrend, the price of a pair is steadily declining. As sellers control the market and drive prices lower, this scenario is defined by a string of lower highs and lower lows in the price movement. The trend line then starts to slope lower. You can draw trend lines to show where the pair reaches a dynamic resistance level along the way.
Sideways Trend Lines
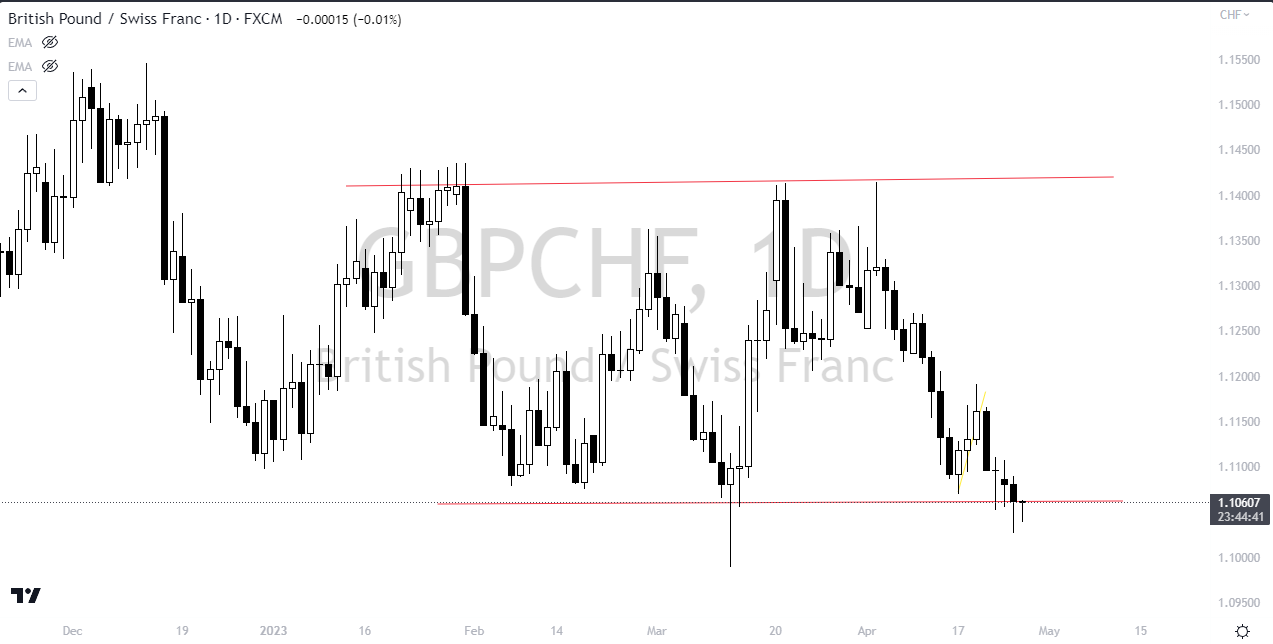
Take a look at the GBP/CHF. Notice how there is a trend line both above and below price. This is a classic sideways trend. Notice each trend line is flat.
When a market is in a sideways trend, the price of a pair going back and forth. As sellers control the market and drive prices lower, the buyers will step in and support the market, and vice versa. This is a simple matter of what is known as consolidation. You can draw trend lines to show where the pair reaches a dynamic resistance or support level along the way. The trend line for both support and resistance levels are typically flat in this scenario. Going back and forth using this basic Forex line trading strategy is a staple of some independent trader careers that have been extremely successful.
How to Draw Trend Lines
You must find a trend in the movement of a pair’s price before you can build a trendline. The trend could be upward or downward. A trendline can be created as seen here:
- Determine the trend’s movement: Determine whether the asset or investment is in an uptrend or a decline by looking at its price movement. A downtrend is defined by a sequence of lower highs and lower lows, whereas an uptrend is defined by a sequence of higher highs and higher lows.
- Connect points on a chart: Look for two or more swing points that connect the trend to find two or more swing points. A swing point is a price high or low that is followed by a change in the trend’s direction. For an uptrend, connect the swing lows, and for a downtrend, connect the swing highs.
- Draw the line: Once the swing spots have been determined, draw a straight line linking them. The trendline is shown by this line. To be declared genuine, the line must touch at least two swing locations.
- Adjust the line: The trendline may occasionally need to be changed to reflect the price movement. In order to touch as many swing points without crossing the price movement, adjust the line as necessary.
- Confirm the trend: After drawing the trendline, you can utilize additional indicators to help you determine the trend’s direction, including moving averages, candlestick patterns, and the RSI.
Identifying Highs and Lows in Forex
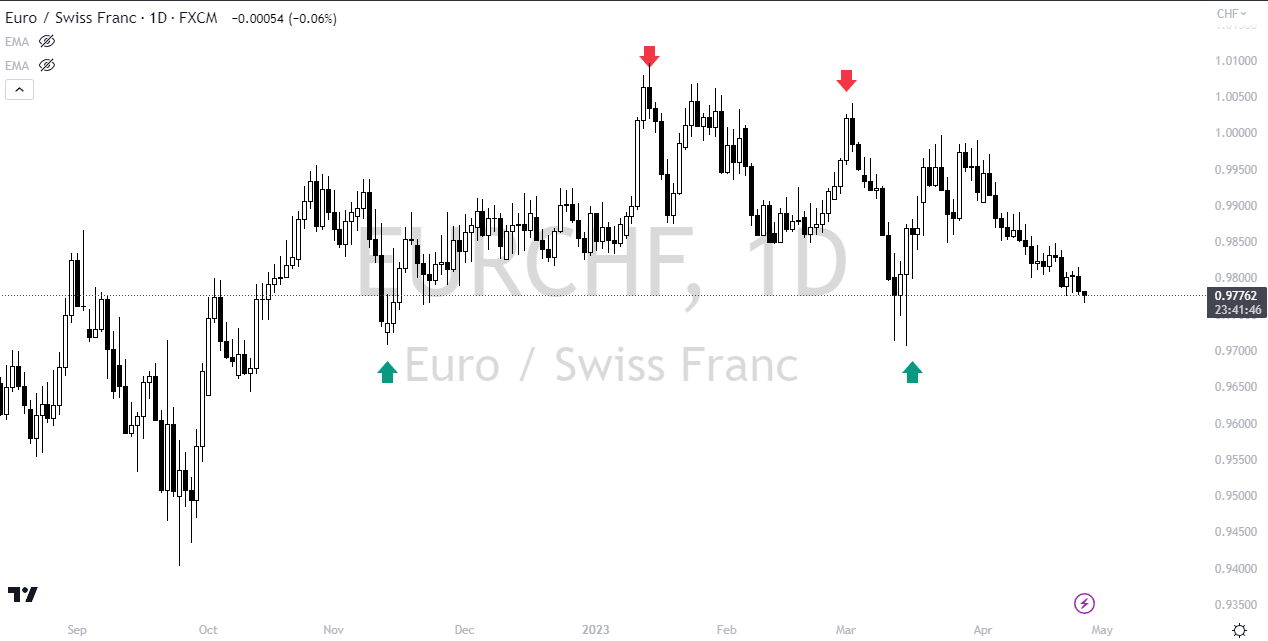
You can see that the chart above clearly shows the swing highs and lows.
A crucial step in creating trendlines to determine the pair’s trends is locating and linking highs and lows on a Forex chart. A general method for locating and connecting highs and lows is as follows:
- Determine the time period: A 1-hour, 4-hour, or daily chart are some examples of the time frames you might choose from for your analysis.
- Track down the high and low points: Find the chart’s top and lowest points for the selected time period. The candlestick wicks often serve as a representation of these points.
- Connect the high and low points: Draw a straight line connecting the high and low points to determine whether a trend is up or down by connecting the two highest or lowest points, respectively.
- Adjust the line: The line should be adjusted, if necessary, to contact as many other high or low points as you can without deviating from the overall attitude of the pair.
- Recognize the trend: Using the trendline you have constructed, ascertain the trend’s direction.
- Repeat the procedure: To gain a more comprehensive understanding of the pair, repeat the procedure for different time frames or Forex pairs. Analysis and strategy goes far beyond the trend line, but the trend line is often the foundation to trade forex successfully.
Extending and Adjusting Trend Lines
Extending and adjusting trend lines is a key aspect of technical analysis used by speculators to identify potential areas of support and resistance in a currency pair’s price movement. Its not just a matter of knowing how to draw trendlines. You need to adjust them at times. Trend lines are drawn on a chart to connect two or more points to identify the direction of the trend, but there can be a bit of variance at times.
Extending trend lines involves projecting the trend line beyond the current price to identify potential areas of future support or resistance. To extend a trend line, you can simply draw the line further into the future, using the same slope and direction as the original line. This can also help with the idea of a future swing high, or even futures swing lows. In the very short term, you typically don’t do as much of this as you would as longer-term Forex traders do.
Adjusting trend lines involves changing the position of the line to better fit the price action on the chart. As the price of a currency pair moves, the original trend line may no longer be accurate, and it may need to be adjusted to reflect the new trend. To adjust a trend line, you can move the line up or down and/or change the slope to fit the new price action.
Using Log Scale for Long-Term Analysis
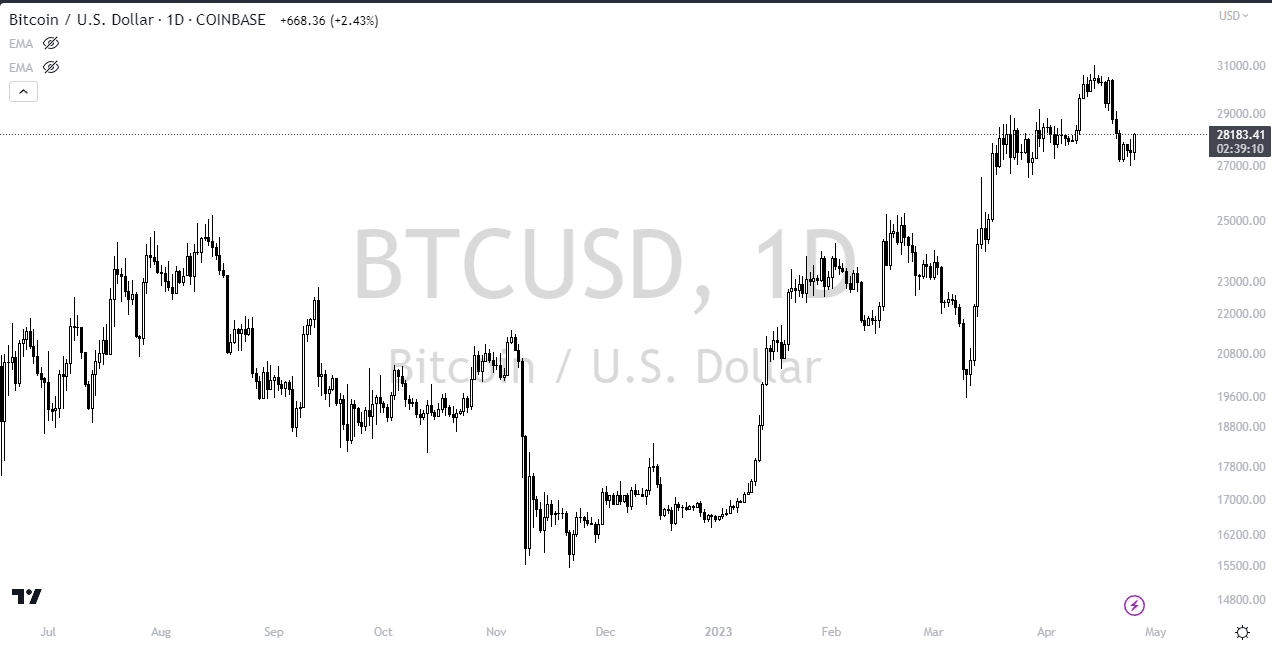
A BTC chart above shows just how different a log chart can be. Notice the prices…
A logarithmic price scale is used on a Forex chart as opposed to a linear one. As a result, a curved line appears on the chart since the gap between price levels widens with rising prices. Using a trend line is a bit more respresentative on what is happening in this type of chart as well.
Forex log scale charts have the following advantages:
- Improved Visualization: Smaller price fluctuations can be difficult to discern on a linear scale chart because significant price swings sometimes take up the majority of the chart. The log scale chart makes it easier to see both large and tiny price swings accurately.
- Better Trend Analysis: Because it may be used by speculators to spot significant price levels and changes in trend direction, the log scale chart is particularly helpful when evaluating long-term trends. Professionals think in terms of percentages, which are respresented better with log charts. Forex line trading opportunities are more clear in this chart as well.
- Simple to Use: Most trading systems offer log scale charts, which are simple to use. With only a few clicks, traders may switch between linear and log scales, making it simple to compare and evaluate price changes.
- Consistent Percentage Change: A log scale chart displays constant percentage changes on the vertical axis, which may be more useful for traders comparing price amplitudes as opposed to absolute values.
Trading Strategies with Trend Lines
Trendlines by themselves aren’t good enough for many traders, and therefore they will often combine them with other indicators in order to get a better read on entries and exits.
Trend Line Breakouts
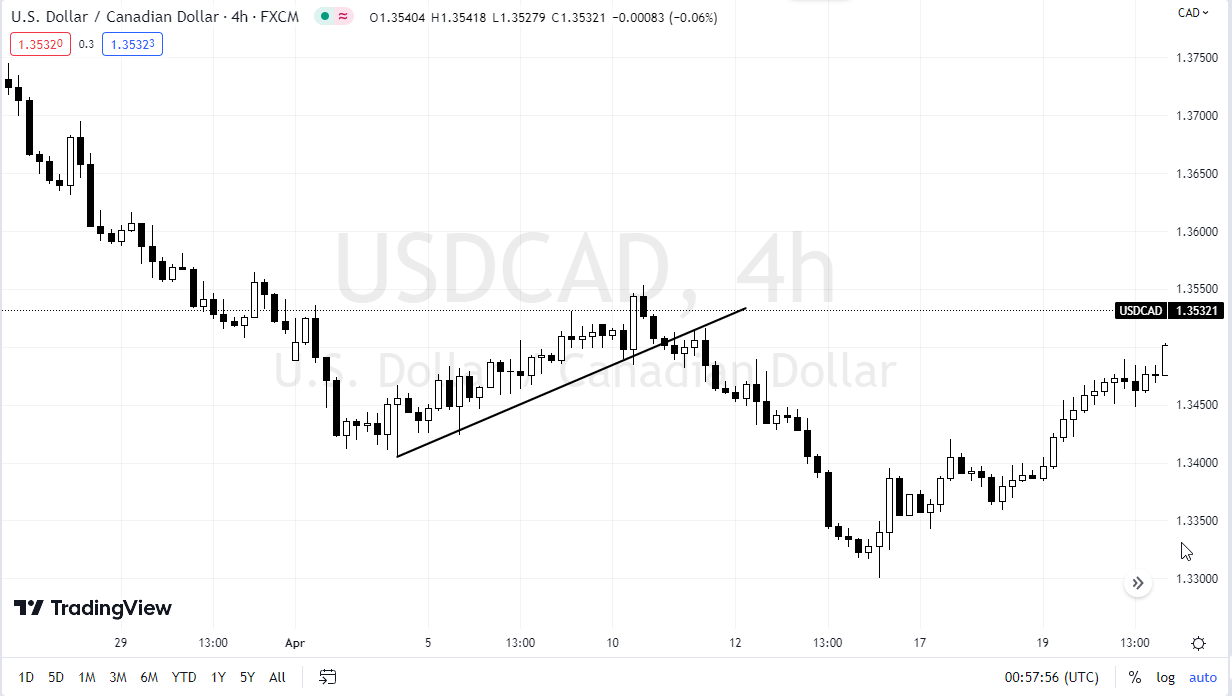
When the price of a currency pair crosses through a trendline, this may indicate a probable shift in the trend’s direction. This is known as a trendline breakout. Trades can be entered or exited using a trendline breakout signal, which can be bullish (upward breakout) or bearish (downward breakout). This is favorite for day traders, as it is so simple.
A general method for trading trendline breakouts is as follows:
- Find the trendline: Connect the highs or lows on the chart to form the trendline, and make sure the trendline has been challenged at least twice or three times. This is the same be it a bar chart, a candlestick chart, or even a line chart. The trend line will work the same. Remember, for a bit of comfirmation, a third touch after rising from the swing high or even swing lows helps.
- Await the breakout: Keep an eye on the price to see if it crosses the trendline. When the price breaks above the trendline, it signals a bullish trendline breakout; when it breaks below, it signals a bearish trendline breakout.
- Confirm the breakthrough: Watch for greater volume and momentum in the breakout’s direction to confirm the breakout. This can be your broker’s tick volume in the Forex world. The uptrend line or negative trend line would work the same.
- Enter the trade: Once the breakout has been verified, place a trade: for a bullish breakout, place a long position; for a bearish breakout, place a short position. To cut potential losses, set a stop loss below the breakthrough level.
- Manage the trade: Keep an eye on the transaction and modify the stop loss as the deal develops to lock in profits or move it to breakeven. This is important for day trading decisions as well, as it allows you to stay in the game, but not feel as much stress.
- Take profits: If the price exhibits evidence of a trend reversal, quit the trade and take profits at the predetermined target level.
Trend Line Bounces
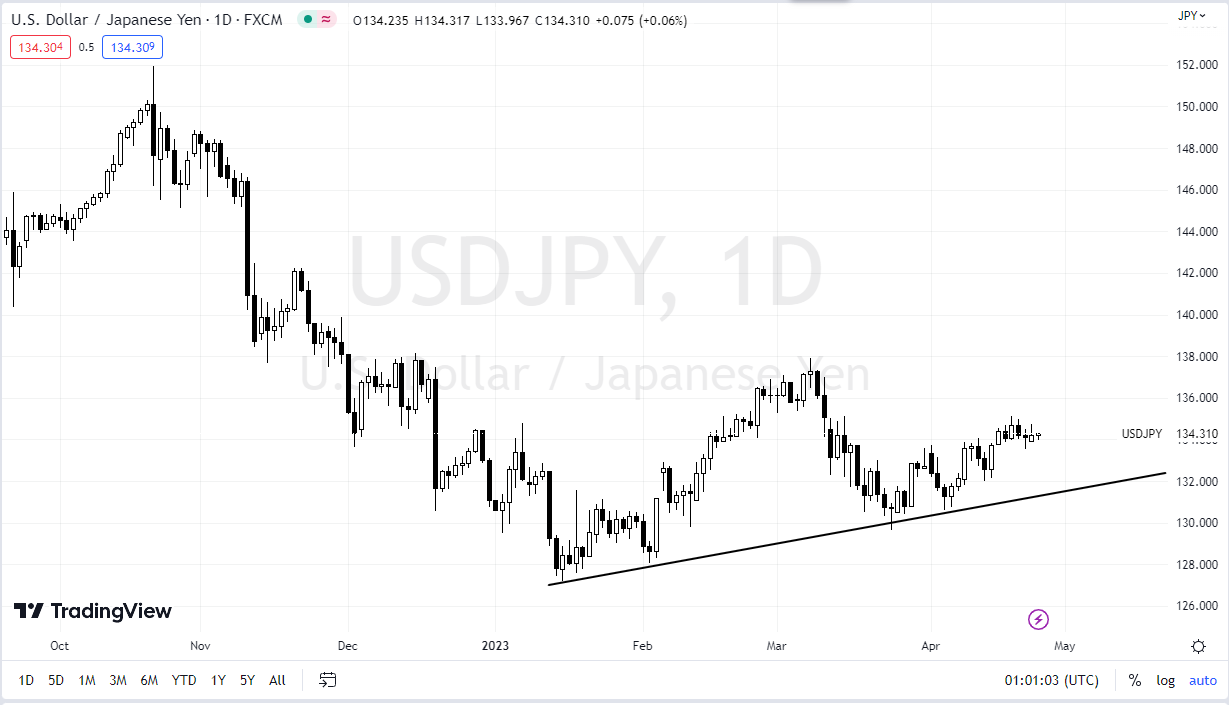
When the price of a currency pair approaches a trendline and then bounces back in the trend’s direction, this is known as a trendline bounce. Trendline bounces can be used by traders as a signal to enter or quit transactions. A move from a longer-term trend line is something that a lot of the trading public will catch a lot of attention.
The general method for trading trendline bounces is as follows:
- Find the trendline: Connect the highs or lows on the chart to form the trendline, and make sure the trendline has been challenged at least twice or three times. A third touch is typically what a lot of trading decisions will be based on. You should look for a weekly chart time frame trend line trading opportunity first, and work your way down to join with the short term traders.
- Wait for the bounce: Watch the price to see whether it approaches the trendline, then wait for the bounce. Watch for a bounce as the price moves closer to the trendline.
- Confirm the bounce: Search for signs of a strong candlestick pattern or more volume in the direction of the bounce. You want to see price action at a trend line.
- Enter the trade: Once the bounce has been verified, place a trade: if the bounce is upward, place a long position; if the bounce is downward, place a short position. To prevent losses, set a stop loss below the bounce level.
- Manage the trade: Keep an eye on the transaction and modify the stop loss as the deal develops to lock in profits or move it to breakeven. Pay attention to how price moves. If price breaks a significant level, its time to do something. Day traders especially need to do this. However, any time frame will have times when this is necessary.
- Take profits: If the price exhibits evidence of a trend reversal, quit the trade and take profits at the predetermined target level. Day trading decisions are especially important to be made ahead of time, as the “heat of the moment” can cloud your decisions.
Combining Trend Lines with Other Technical Indicators.
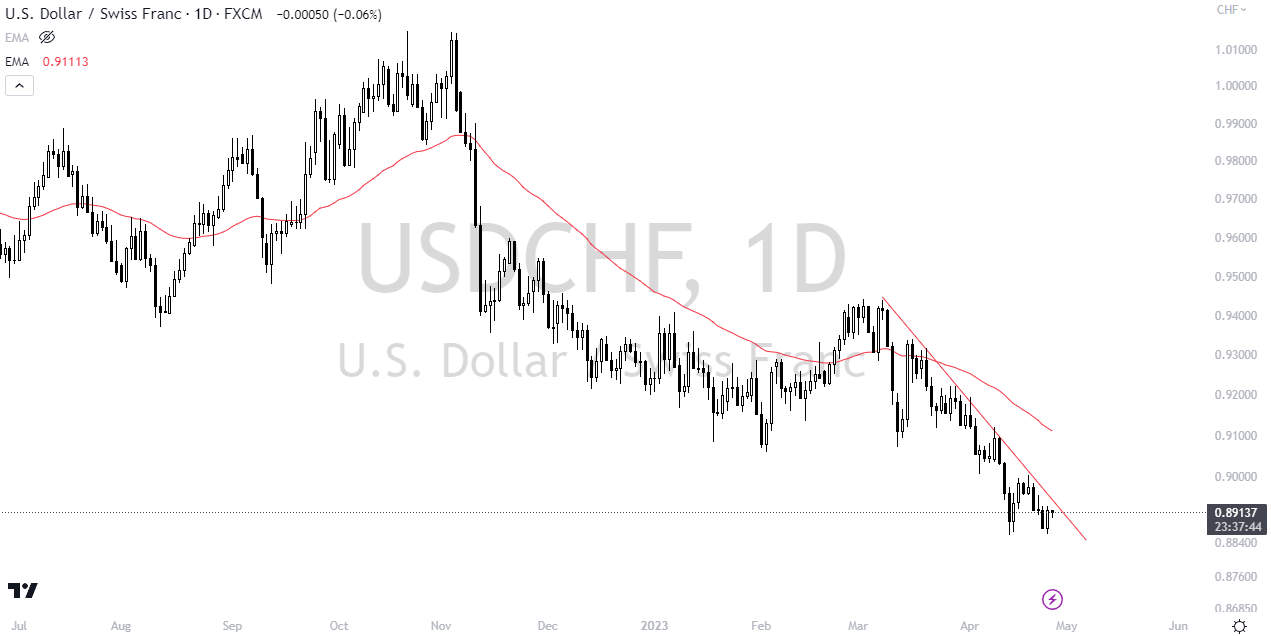
The USD/CHF chart above shows the downtrend with both a line and the EMA.
In order to confirm trading signals and pinpoint potential entry and exit positions, traders frequently combine trend lines with other technical indicators. Traders can decrease the possibility of false signals and improve the accuracy of their transactions by combining different indicators. Furthermore, a longer-term trend line tends to have more reliability.
Utilizing oscillators, such as the Relative Strength Index (RSI) or Stochastic Oscillator, to validate probable trend reversals is one technique to employ trend lines in conjunction with other indicators. A potential trend reversal may be indicated, for instance, if a trader observes a trend line break and the RSI indicates that the currency pair is overbought or oversold. This could be a sign for the trader to place a buy or sell order.
Using moving averages to validate the trend’s direction is another technique to use trend lines in conjunction with other indicators. For instance, a bullish trend line may confirm an upward trend and give a signal to take a long position if the price is above its 50-day moving average. This is a common strategy of Forex traders.
To find probable regions of support and resistance and to validate trading signals, traders can also combine trend lines with other technical indicators like Bollinger Bands, Fibonacci retracements, or moving averages.
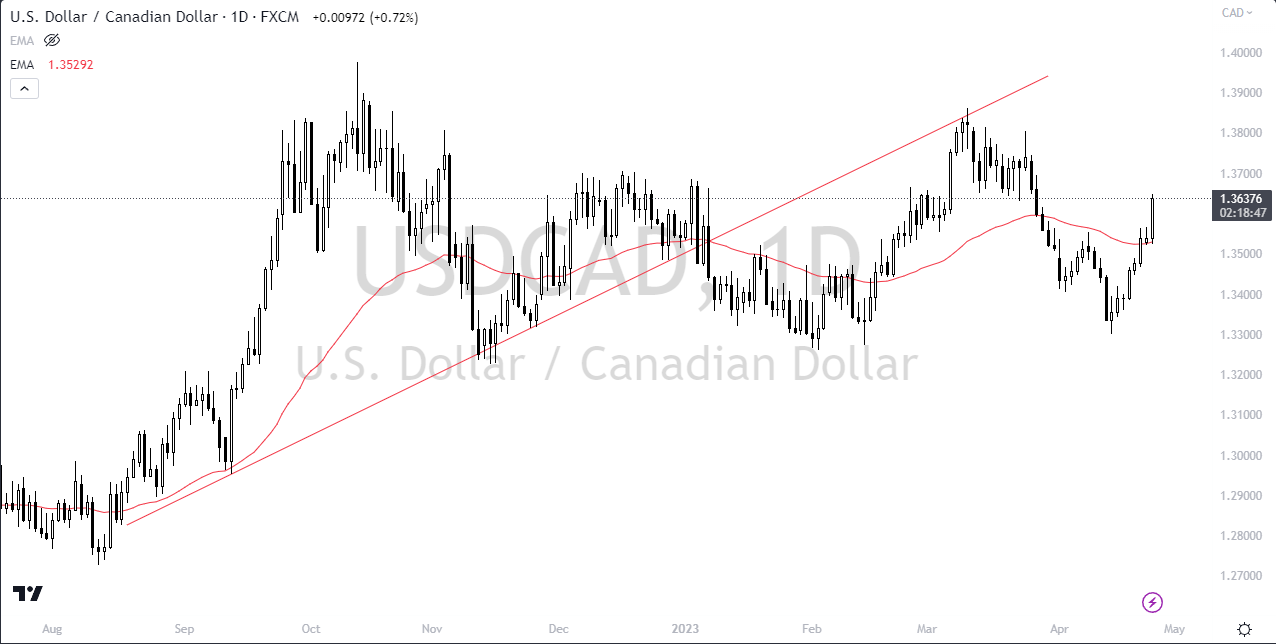
The example above show a trend line trading strategy, taking the trendline break. Notice that the 50-Day EMA is also breaking below it at the same time. This lead to a pullback.
Limitations of Trend Lines
Although trendlines are a helpful tool in forex trading, they also have certain drawbacks. The following are some drawbacks of using trendlines in the FX markets:
- Subjective Nature: Due to their subjective nature, trendlines can be drawn in a variety of ways by different traders, which could result in contradicting signals and probable misunderstanding. However, a longer-term trend line is typically more reliable.
- False Breakouts: Trendlines can occasionally be momentarily broken, producing a false signal that could influence bad trading choices. When trend lines are broken, sometimes the market will jump back over them. (This is referred to as a “false breakout.”)
- Lagging Indicators: Trendlines are lagging indicators since they display past price movements rather than forecasting future ones. This may reduce their ability to forecast future price changes. However, there is typically a proclivity to respond to a trend line.
- Whipsawing: Price movements can whipsaw back and forth across a trendline due to the pair’s volatility, making it challenging to tell whether a trendline has been broken or not.
- Over-Reliance: Making trading decisions based solely on trendlines without taking into account other elements like economic news and indicators might result in missed trading chances. Also, structurally markets change. If the pair were to break swing lows as an example, its probably going lower regardless of any line trading mark up you have on the chart.
While trendlines can be a useful tool in a forex line trading strategy, the trendline strategy should also include other indicators in order to help avoid false breakouts, and to get confirmation of both support/resistance level, but also whether or not the pair is likely to pay attention to the potential buying or selling opportunities at each trend line.
Key Tips for Successful Trend Line Trading
Recognize that trendlines can give you an idea as to what the trend is in a market. You will find trading Forex much more enjoyable and profitable if you are following the overall trend, and going with the market. In fact, most professional traders will not trade against the trend at all.
Making sure that the trendline is touched at least 3 times is one thing that you can do to keep the accuracy and consistency in your trading system, but it is also not the “be-all end-all” of the trading Holy Grail, but it is a good solid foundation. Most traders will also add other indicators along with trendlines in order to increase performance as well.
The most important thing that you can do is to continue reading and learning as the journey to profitability is one that’s ever evolving, and takes a lot of effort. However, having the right tools will be the first thing to do in order to become successful.
Conclusion
In conclusion, it’s important to understand that trend lines are a crucial tool for trend defining, which is your first step to making money Forex trading. Following a strong trend is by far the best way to be in the market. You need the market to move your position right along in order to make money. You need to work with the overall market, not against it.
You need to make sure that you have a valid trend line that you are working with, and it is only a valid trend line when it is confirmed by price action, and of course other indicators sometimes. Your price charts will be a reflection of how you see the market conditions. Drawing trend lines help you visualize that. Trend line trading is the most basic of trading strategy types.
Trend lines are the most basic tool that you can use, and even the most professional and experienced traders are very well aware of their power. Using trendlines can keep you on the right side of the trade, which is by far your biggest challenge. Trading in the opposite direction of a trendline is a great way to lose money, at least until the market truly breaks through it.


